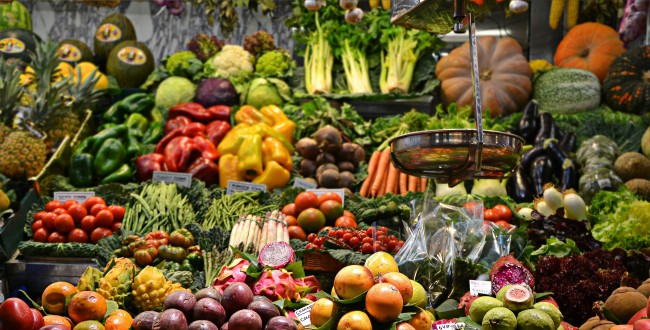
Photo by Kristen Goo via Flickr

One-third of all food produced is never eaten. Halving food loss and waste by 2030 will be essential for reducing the emissions and biodiversity loss linked to producing, transporting and disposing of uneaten foods.

The impacts of global food loss and waste

Globally, one-third of food produced by weight goes uneaten, equating to about 24% of the world’s calories. Food loss and waste result in economic losses for producers and consumers; contributes to food insecurity; and represents a “waste” of agricultural land, water, fertilizer, pesticides and other agricultural inputs.

Reducing food loss and waste can therefore make more food available for a growing global population while also decreasing agricultural land demand, which drives biodiversity loss and emissions from deforestation and other land-use changes. It can also reduce the greenhouse gas (GHG) emissions associated with producing, transporting and disposing of uneaten foods, which account for between 8% and 17% of global GHG emissions.

Strategies for reducing food loss and waste

While global food loss and waste is substantial in aggregate, food is typically lost or wasted in relatively small amounts across entire supply chains, making it complicated to address given the large number of actors contributing to the problem. Nevertheless, halving global food loss and waste rates has substantial mitigation potential and can help bring food system–related GHG emissions in line with pathways that limit warming to 1.5 degrees C (2.7 degrees F), in addition to decreasing land use, reducing biodiversity harms and aligning with the United Nations Sustainable Development Goal Target 12.3.

Though the magnitude and types of changes required vary, all countries and regions should reduce food loss and waste as part of their broader efforts to foster sustainable food systems. While this shift is focused on reducing food loss and waste at the source (ideally leading to reduced agricultural demand), additional circular economy measures can be taken to minimize waste that does occur, such as by composting organic waste.

Graphic showing drivers of food loss and waste across the supply chain

Government and corporate actions to reduce food loss and waste

Over the past decade, an increasing number of governmental, financial and corporate commitments have been made to reduce food loss and waste, along with emerging actions to fulfill those commitments. At the same time, the two key indicators tracking global progress have not seen corresponding decreases in food loss (food that becomes unfit for consumption during harvest, storage, processing or transport to market) or food waste (food that is thrown out or spoiled in retail markets, restaurants and homes).

Substantial efforts are needed to get the world on track to halve global food loss and waste by 2030. More countries must implement public policies aimed at reducing food loss and waste at scale. This includes, for instance, standardizing food labeling, changing food liability laws, expanding public-private partnerships with food companies, increasing investment in research and adoption of new technologies and practices, and implementing educational campaigns.

Enhancements in infrastructure can improve access to markets, information and technologies that could help reduce food losses.

Currently, insufficient data limits the tracking of some trends. More comprehensive, consistent and accurate data is urgently needed to monitor the implementation and efficacy of food loss and waste interventions.

Tracking progress on global outcomes

3048: Share of food production lost

Status: Well Off Track
Historical Data Methodology and Challenges:

The Food and Agriculture Organization (FAO) published its first estimates of global food loss in its 2019 Food Loss Index Report, which estimated the share of food production lost globally in 2016. Since then, FAO has updated its historical data to include annual data on the share of food production lost globally and by region from 2015 onwards.

The disaggregation of food losses by food group was calculated by dividing the volume of losses for each food group by the domestic supply quantity. Unlike the share of global food loss dataset, data on food losses by food group is available beginning in 2010 and is available at the country level.

Target Methodology:

While UN Sustainable Development Goal Target 12.3 aims to reduce food losses along production and supply chains between 2015 and 2030, it does not quantify a reduction target as it does with food waste. The “Breakthrough Technologies” scenario in the World Resources Report on "Creating a Sustainable Food Future” — which limits greenhouse gas emissions from agricultural production to no more than 4 gigatonnes of carbon dioxide equivalent per year (GtCO2e/yr), in line with a 1.5 degrees C pathway — modeled a reduction in food loss of 50% between 2010 and 2050. We adopted a more ambitious timeline for reaching this target — a 50% reduction in food loss between the first global food loss estimate in 2016 and 2030 — to align with existing governmental and private sector commitments around the world. In contrast to other targets in which the highest mitigation potential scenarios may present trade-offs in terms of equity, there are few (if any) social and environmental harms to adopting this more ambitious target timeline, as it can also help advance the economic, food security and resilience co-benefits that come from reducing food waste sooner. The 50% reduction target was maintained through 2050.

Progress Assessment Methodology:

While global progress was assessed primarily following methods outlined in this technical note, some deviations were made. Though global progress made toward this target essentially stagnated, we classified change as heading in the right direction but well off track, given the slight decrease in the annual average change (-0.01 percentage points) in food loss from 2019 to 2023.

Food loss occurs when food is spoiled or becomes unfit for human consumption during harvest, storage, processing or transport to market. Food losses are driven by a variety of challenges, including inadequate harvesting and processing equipment, insufficient storage (e.g., refrigeration) and packaging, inflexible procurement requirements, and norms and attitudes around which foods are appealing (e.g., causing misshapen but edible produce to be discarded). Increasing the share of food produced that reaches markets may improve farmers’ incomes, food availability and environmental outcomes, though in some cases, not all of these outcomes may be achieved simultaneously.

Globally, the rate of food loss remained stagnant at roughly 13% between 2015 (the first year of global food loss estimates) and 2023 (the most recent year of data). This rate is far above the target of halving food loss — to 6.5% — by 2030. Globally, rates of food loss are greatest for starchy roots, fruits and vegetables. Substantial efforts are needed at both the global and regional levels to halve food losses by 2030.

Additionally, food loss that occurs on farms pre-harvest is typically excluded from food loss and waste inventories — including those reported in the data in our figures — due to measurement challenges and underlying differences in the nature of the data. That said, pre-harvest losses represent a substantial additional source of emissions that could be measured and reduced moving forward. 

3049: Food waste

Status: Insufficient Data
Historical Data Methodology and Challenges:

Thus far, the UN Environment Programme (UNEP) has only published global food waste estimates for 2019 and 2022. Global estimates are generated from population-weighted country-level estimates using 1) measured national and subnational data points on food waste, compiled from a literature review, and 2) extrapolation of estimates for countries without relevant studies. The greatest amount of evidence comes from high-income countries and pertains to household food waste. More data is needed to track nationally representative food waste levels in middle- and low-income countries, especially at the food service and retail levels.

Target Methodology:

The “Breakthrough Technologies” scenario in the World Resources Report on “Creating a Sustainable Food Future” — which limits greenhouse gas emissions from agricultural production to no more than 4 gigatonnes of carbon dioxide equivalent per year (GtCO2e/yr), in line with a 1.5 degrees C pathway — modeled a reduction in food waste by 50% by 2050. We adopted a more ambitious timeline (2030) for reaching this 50% reduction target to align with UN Sustainable Development Goal Target 12.3 and existing governmental and private sector commitments around the world. In contrast to other targets in which the highest mitigation potential scenarios may present trade-offs in terms of equity, there are few (if any) social and environmental harms to adopting this more ambitious target timeline, as it can also help advance the economic, food security and resilience co-benefits that come from reducing food waste sooner. The 50% reduction target was maintained through 2050.

Progress Assessment Methodology:

While global progress was assessed primarily following methods outlined in this technical note, some deviations were made. UNEP clarified in its Food Waste Index Report 2024 that the apparent increase in food waste between its two published global estimates (from 2019 and 2022) is “not believed to represent a real increase in food waste per capita” (p. 46); it is likely due to increased accuracy of food waste estimates. For this reason, we have labeled this progress category as “insufficient data.”

Food waste occurs when food is thrown out or spoiled in homes, restaurants or retail markets. Buying more food than will be sold or consumed, inadequate food preparation skills and knowledge that result in avoidable waste, and concerns about food safety risks are among the numerous drivers of food waste. Reducing food waste can save money for consumers, retailers and food service providers, in addition to reducing the environmental impacts of that waste.

In 2022, approximately 19% of food available to buy was wasted — a global average of 132 kilograms per person. Of the nearly 1.1 billion tonnes of food wasted, the largest share of this waste (60%) occurred at the household level, with another 28% at the food service level and 12% at the retail level. While the estimated per capita food waste in 2022 was higher than the first global estimate reported for 2019, these differences are likely due to increased data accuracy. Given the data limitations, it is too early to assess global progress toward the target.

While early research suggested that food waste was more prevalent in developed countries, recent evidence indicates that on average, per capita household food waste occurs at similar rates across high-income, upper-middle-income, and lower-middle-income countries. More research is needed to compare food waste rates in food service and retail across countries.

While progress may lag due to delays in the implementation of food waste policies, the available data indicates the importance of consistently tracking food waste data to monitor the effectiveness of interventions and sustain progress over time.

Key enablers and barriers to change

3005: Countries committing to reducing food loss and waste in their NDCs

Historical Data Methodology and Challenges:

Commitments to reducing food loss and waste in NDCs have not been consistently tracked by a single source over time. The data presented in this figure is compiled from multiple sources to display progress over time. Systems Change Lab researchers reviewed NDCs that were flagged as addressing food loss and waste reduction by WRAP (2022), WWF/Climate Focus (2022) and Climate Watch (2025). Only NDCs that included measures specific to the reduction of food loss and waste rather than landfill diversion or composting are analyzed here. This analysis reflects the status of NDCs at the end of each calendar year.

For many countries, nationally determined contributions (NDCs) form the foundation of international climate action. They, for example, can help guide domestic policymaking across the whole of government, signal the direction of travel to public and private sector investors and enable more effective implementation.

Data on the greenhouse gas (GHG) emissions associated with food loss and waste is limited, but it is estimated to account for between 8% and 17% of global GHG emissions. The inclusion of measures to address food loss and waste within NDCs can therefore play an important role in raising the political profile of reducing food loss and waste as part of countries’ broader efforts to mitigate climate change.

Among NDCs submitted as of March 2025, 23 countries (12% of countries that had submitted NDCs) included measures to reduce food loss and waste in their NDCs, an increase compared to 6 countries (3.3%) that had submitted NDCs as of 2019. Additionally, in 2021, 11 countries and two regional blocs (the African Union and European Union) — representing 55% of the global population — set food loss and waste reduction targets outside of their NDCs.

Including measures to reduce food loss and waste in national adaptation plans (NAPs), such as reducing post-harvest losses, can also help increase low-income countries’ adaptation and resilience to climate change in particular, though no datasets currently track commitments in NAPs.

3006: National policies to reduce food loss and waste, as measured by people living in countries acting to reduce food loss and waste at scale

Historical Data Methodology and Challenges:

This indicator is included in the Champions 12.3 progress reports. These publications originally tracked progress toward this indicator on an annual basis (2018, 2019). Starting with 2021 data (released in 2022), progress will be updated every three years.

The costs of reducing food loss and waste — including, for instance, financial, food safety risks, time and liability — may sometimes be perceived to outweigh the benefits to a company or individual. Governments therefore play an important role in motivating and coordinating actions to reduce food loss and waste across supply chains.

Given the diversity of drivers of food loss and waste, a variety of policies, laws and regulations will likely be needed. Such actions may include developing and implementing national strategies to reduce food loss and waste, providing funding to support the adoption of new technologies and practices (e.g., refrigerated storage systems or software for forecasting supply and demand) and standardizing food date labeling on packaged foods to reduce consumer confusion over food safety. In countries with strong legal structures, changing laws to reduce liability concerns with donating food may also help prevent food from otherwise going to waste.

The share of the world’s population living in countries acting at scale to reduce food loss and waste has increased substantially in recent years, from countries representing 14% of the global population at the end of 2018 to countries representing 52% of the global population by the end of 2024.

The Global Food Donation Policy Atlas examines countries’ policies on a variety of food loss and waste topics. Examples of national policies categorized as “strong” by the Atlas include Australia’s National Food Waste Strategy, Canada’s National Food Policy, Colombia’s National Policy Against Food Loss and Waste, and China’s Anti-Food Waste Law. India has set clear standards regarding leftover food that may be donated, and the United Kingdom has published a notable policy to standardize date labeling. Argentina, Brazil, Ecuador, Paraguay and the United States offer comprehensive liability protections for food donors and recovery organizations. Additionally, beyond national policies, the European Union agreed to the first legally binding food loss and food waste reduction targets in the world in February 2025.

3007: Food and agriculture companies with active food loss and waste reduction programs

Historical Data Methodology and Challenges:

This indicator is tracked in the Champions 12.3 progress reports. These publications originally reported progress toward this indicator on an annual basis (2017, 2018, 2019). Starting with 2021 data (released in 2022), progress will be updated every three years.

The World Benchmarking Alliance has begun tracking the share of the top 350 food and agriculture companies working to reduce food loss and waste in their operations and supply chain. However, it does not include an indicator similar enough to the one on food waste reduction programs tracked by Champions 12.3 to compare directly. Given the longer trend data available, the Champions 12.3 reports were selected as the data source for the figures presented here, though this selection may change as more data becomes available.

Reductions reported above are based on companies’ self-reported reductions in food loss and waste. Some companies may work with external auditors for third-party verification of their findings, but that is not tracked by the Champions 12.3 Coalition.

As of 2024, 80% of the top 50 food and agriculture companies had established targets to reduce food loss and waste. While setting targets to reduce food loss and waste is important for focusing attention on the issue and setting ambition, companies must also take actions to implement their targets. Such actions may include investing in improved supply and demand forecasting, training staff on best practices to reduce food loss and waste, switching to optimal packaging, re-engineering processing to reduce losses and waste, abandoning marketing strategies that incentivize over-purchasing and offering smaller portion sizes.

The share of the world’s top 50 food and agriculture companies that have active food loss and waste reduction programs has increased substantially, from 10% of companies in 2017 to 60% of companies in 2024. Encouragingly, some companies are already reporting substantial reductions in their food waste due to such actions, including IKEA’s largest retailer Ingka Group (54% reduction), Fresh Del Monte (42% reduction), Ahold Delhaize (35% reduction), Danone North America (30% reduction) and Kroger (26% reduction). The 10x20kx30 initiative will also engage 10 large agricultural companies to support over 200,000 small producers in reducing food losses during and after harvest.

3008: People living in countries measuring and reporting on food loss and waste

Historical Data Methodology and Challenges:

This indicator is tracked in the Champions 12.3 progress reports. These publications originally reported progress toward this indicator on an annual basis (2017, 2018, 2019). Starting with 2021 data (released in 2022), progress will be updated every three years.

The development of the Food and Agriculture Organization’s Food Loss Index and the UN Environment Programme’s Food Waste Index represents important efforts to collect food loss and waste data and generate global and country-specific estimates.

However, country-level estimates remain relatively uncertain and uneven in coverage, most are not regularly updated, many are not comparable with one another or over time and most are not disaggregated by different stages in the supply chain. Without this data, it remains difficult to know where to target limited resources and capacities to most effectively reduce food loss and waste. Additionally, measuring and publicly reporting on progress enables greater transparency and accountability.

While the number of countries with regularly updated, publicly available food loss and waste inventories almost doubled from 2017 to 2021, the share still remains quite low. Countries representing only 12% of the world’s population reported this data as of 2021.

3009: Food and agriculture companies measuring and reporting on food loss and waste

Historical Data Methodology and Challenges:

This indicator is tracked in the Champions 12.3 progress reports. These publications originally reported progress toward this indicator on an annual basis in 2018 and 2019. Starting with 2021 data (released in 2022), progress will be updated every three years.

The World Benchmarking Alliance has also begun tracking the share of the top 350 food and agriculture companies (of which only 337 were deemed applicable for this indicator) that are measuring food loss and waste across their operations. Disaggregated data for this indicator was made available for the first time in 2023. Given the longer trend data available, the Champions 12.3 reports were selected as the data source for the figures presented here, though this selection may change as more data becomes available.

Corporate efforts to collect data on food loss and waste across their supply chains can provide the foundation for companies to develop targets and implement actions to reduce food loss and waste. They can also help inform national food loss and waste inventories. Additionally, publicly reporting on progress enables greater transparency and accountability.

The share of the world’s 50 largest food companies that are measuring their food loss and waste increased from 32% in 2018 to 56% in 2021. About two-thirds of the companies that measure their food loss and waste publicly report their progress. However, a more recent assessment covering the top 350 food and agriculture companies found that as of 2023, only 16% of relevant companies measured food loss and waste.

3010: Investment in research and development for food loss and waste

While commercially available technologies that could help reduce food loss and waste are emerging, some of those under development have not yet been tested outside of controlled, laboratory settings. For example, researchers are exploring solutions to either chemically or mechanically preserve produce directly or through their packaging or transportation systems to extend their shelf life. More behavioral science research is also needed to understand which policies and interventions are most effective in reducing food loss and waste in different contexts and over the long term.

There is currently no publicly available information on global spending on research and development (R&D) on technologies and interventions to reduce food loss and waste. That said, some R&D spending may be included in broader estimates of the total amount of finance dedicated to reducing food loss and waste. We will continue to monitor the availability of global data for this indicator.

3011: Market access, as measured by the rural population who live within two kilometers of an all-season road

Historical Data Methodology and Challenges:

This indicator aligns with UN Sustainable Development Goal indicator 9.1.1. It is tracked by the World Bank’s Rural Access Index using data on population distribution from WorldPop or national censuses, along with data on road location and quality from national road agencies. Because national road condition surveys are only updated every three to five years, this indicator will be updated on a similar timeframe. As of 2024, this indicator has only been calculated for 29 countries, most of which have only one data point thus far.

Poor infrastructure, including the lack of usable roads, can constrain access to markets, slow the transit of food away from farms and increase the likelihood that food is spoiled or damaged once it has left the farm. Given the difficulty in measuring many of the infrastructure challenges that increase post-harvest losses, this indicator focuses on rural communities’ access to roads. Though this is a measurable proxy for access to markets, it only addresses one facet of this challenge.

As of 2024, the World Bank had assembled data on the Rural Access Index (RAI), an index that measures access to transportation in rural areas, for only 29 countries, mostly in Africa and the Middle East. For most countries, data is available only for a single year between 2009 and 2022, so the measurements are not necessarily comparable across countries. The reported share of rural population living within two kilometers of an all-season road varies substantially, ranging from 18% in Lesotho (2016 data) to over 99% in the United Arab Emirates (2021 data).

Similarly, a global map of travel time to cities (which are usually the market centers and thus serve as an indicator for market accessibility), revealed that only 51% of people in low-income countries live within an hour of a city, compared to 91% in high-income countries.

In addition to creating opportunities to reduce post-harvest food losses, improving access to all-season roads may also enhance agricultural productivity and resilience. Road access, however, sometimes drives deforestation and biodiversity loss, creating environmental trade-offs that may undermine long-term sustainability. These varying outcomes highlight the importance of considering local conditions and complementary factors when assessing the impact of road infrastructure on intended outcomes.

Given the limited coverage and lack of time series data, there is a clear need for more comprehensive and consistent data collection to effectively measure road access over time and across a broader range of countries.

3012: Population with access to electricity

Historical Data Methodology and Challenges:

The data was collected directly from the SDG 7.1.1 Electrification Dataset provided by the World Bank. The source collects data every two to three years and estimates the missing values using a multi-level nonparametric modeling approach that was developed by the World Health Organization for estimating clean fuel use. Electricity access is measured using surveys. The data presented here reflects Tier 1 access (including small solar home systems and small photovoltaic mini-grid access) and above for about 20 countries that use a multi-tier framework and reflects a binary measure for other countries.

One limitation of this indicator is that connection to the grid does not guarantee reliable and affordable access to electricity. Many people that are connected to the grid still suffer from power outages or unaffordable rates. See the energy supply system for more information on these aspects of electricity access.

Poor infrastructure, such as access to electricity and the internet, can constrain access to markets, limit uptake of technologies that could help reduce on-farm and post-harvest losses and increase the likelihood of deterioration once food has left the farm. Electricity, in particular, is needed to support digital services, cold storage solutions like refrigeration, and processing facilities. It is also critical to advancing a just and equitable energy transition. As with access to roads, access to electricity is only one facet of the infrastructure challenges that increase food losses.

The share of the global population with access to electricity steadily increased from 78% in 2000 to 91% in 2022, though this still falls short of the pace needed to reach universal access to electricity by 2030. Access to electricity remains limited primarily in sub-Saharan Africa.

To ensure universal access to electricity by 2030, significant investments in grid expansion and decentralized renewable energy solutions will be essential. Additionally, targeted policies to support affordability and accessibility, especially in remote rural areas, will be important. Integrating energy access with agricultural development and climate mitigation and adaptation strategies can help unlock the full potential of rural electrification to drive sustainable and equitable development.

3013: Finance dedicated to reducing food loss and waste

Historical Data Methodology and Challenges:

Public, private and philanthropic values were manually extracted from the “Capital over time” figure. The total annual values were aggregated from there.

The ReFED Capital Tracker tracks investments of $5,000 and greater in solutions to reduce food loss and waste from the United States, including the funder, recipient, type of capital (public, private, philanthropic), solution type (e.g., prevention, rescue, recycling), date and description of the initiatives.

Private capital investments are tracked using data from PitchBook and include venture capital, private equity, corporate finance and spending and commercial project finance.

Philanthropic capital investments, including non-government grants and impact-first investment, are tracked using data from the U.S. Internal Revenue Service (IRS). Data lags of up to two to three years limit the comprehensiveness of the data on philanthropic investments due to reporting requirements and IRS service disruptions.

Information on public funding in the form of federal government grants and financing are sourced from the U.S. Office of Management and Budget. A comparable and consistent data source is not currently available to track public funding in food loss and waste solutions from local and state governments.

Other limitations and details are available in the full methodology. Data reported here comes from the Capital Tracker beta version and will be updated as new data becomes available.

In addition to innovations in research, improving access to existing technologies, infrastructure and equipment is needed to reduce food loss and waste. Public and private finance to deploy existing interventions will be needed, particularly in lower-income countries.

Examples of such interventions include refrigerated storage and transport systems, industrial drying systems, packaging materials, communications technologies to optimize processes and improved software for forecasting supply and demand, though the appropriateness and effectiveness of interventions vary in different contexts. Access to extension services for producers to reduce food loss and training for retail and food service employees on best practices to reduce food waste present opportunities for intervention.

The ReFED Capital Tracker tracks the growth in investments in solutions to reduce food loss and waste, including prevention, rescue and recycling. Although the dataset is limited to the United States, it represents a tangible approach for monitoring the growth of finance dedicated to these solutions that other countries could replicate. From 2012 to 2024, investments in solutions to reduce food loss and waste totaled over $11 billion cumulatively in the United States, with notably high levels in 2021 and 2022. The vast majority of these investments have come from private sources (97%), compared to philanthropic (1.6%) and public (1.0%) spending.

3014: Access to credit, as measured by the adult population that borrowed money from a financial institution

3015: Access to agricultural extension services, as measured by the ratio of extension agents to farmers

Historical Data Methodology and Challenges:

While no recent data is available, the Global Forum for Rural Advisory Services reports the number of extension agents per country between 2009 and 2012.

Limited food management knowledge, skills and practices across those working in food supply chains are a key driver of food loss and waste. With adequate and independent funding, agricultural extension services can help close these gaps upstream in food supply chains. They can enhance the ability of farmers, as well as small and medium enterprises, to adopt improved practices or new technologies that can reduce food losses.

The ratio of extension agents to farmers represents a proxy for the share of farmers with access to extension services. While recent data is not available, 2012 data from the Global Forum for Rural Advisory Services indicated great variability across countries. For example, in China and Vietnam, there was one extension worker for every 280 farm households, while in Indonesia, each worker supported about 2.8 villages. In India, only 6.8% of farmers were reached due to unfilled positions, leaving farmers to rely on peers or input dealers for advice. More data is needed to monitor changes in the availability of extension agents over time.

Even with potential increases in service accessibility, many developing countries face additional challenges that can hinder the efficiency and effectiveness of agricultural extension services. This includes weak connections among research, education and extension institutions; inadequate coverage; limited infrastructure; restricted access to credit and markets; financial limitations; and lack of diverse approaches.

While the number of extension agents is an important indicator, the quality and relevance of extension services are equally critical. Extension quality encompasses multiple dimensions, including the relevance, availability, timeliness, cost and appropriateness of delivery methods. The quality of extension services can significantly impact the satisfaction and adoption of encouraged strategies by farmers and others working in food supply chains.

3016: Households reached by public education campaigns to reduce food waste

About 60% of food waste occurs at the household level. In addition to government policy and retailer changes that can enable opportunities to shift household behavior, public campaigns need to build consumers’ ability to reduce food waste through increased food management knowledge, skills and practices. Examples include providing information on using shopping lists and meal plans and properly storing and using up food. Shifting social and cultural norms around food waste is also critical for creating a foundation from which to promote prevention behaviors.

Currently, efforts to track the share of households reached by consumer education campaigns to reduce food waste are lacking. We have included this indicator to highlight how consumer behavior needs to change, while also recognizing that the evidence base for effective strategies to do so is limited. Campaigns that offer consumers tangible tools and resources on how to reduce food waste (rather than why) are likely to be most effective. Public education campaigns may be beneficial, but are insufficient on their own to significantly reduce food waste.

3017: Annual revenue from foods sold that would otherwise be lost or wasted

Crops that do not meet quality or cosmetic standards set by food retailers or consumer expectations are often discarded or not purchased. Similarly, foods that are close to their expiration dates or that have been damaged in storage or transit are often thrown away. By one estimate, 70% of food loss and waste globally occurs before the food even reaches consumers.

To reduce these losses and wastes, alternative markets need to be created. This may include, for instance, selling foods with aesthetic flaws or foods about to expire at a moderate discount, and using crops that don't meet consumer standards for inputs in food processing or for animal feed. Such efforts will need to be context specific, as what characteristics of foods are considered desirable or edible differ by culture, individual preferences and types of foods consumed (for example, processed vs. fresh, refrigerated vs. not).

For example, supermarkets and online retailers in the United States and Europe have begun campaigns to encourage sales of unattractive produce, with some research suggesting labeling foods as “ugly” rather than “imperfect” to be the most effective. In Japan and South Korea, centralized systems safely recycle 36% to 43% of their food waste into feed for pigs. Some foods that don’t meet cosmetic or quality standards are already used for animal feeds or soil amendments; to minimize the potential for such solutions to increase environmental pressures for additional land use elsewhere, optimal solutions will focus on diverting foods that would be sent to landfills back into the human food supply.

There is currently no publicly available global data on the value or volume of markets for foods that would otherwise be lost or wasted. This indicator highlights the role that alternative markets can play in both reducing food loss and waste and generating alternative sources of profit for farmers and food businesses.

Other shift Other shifts needed to transform the system

Increase agricultural productivity sustainably, resiliently and without expanding into high-carbon, biodiverse ecosystems

Meeting the food and nutrition needs of a growing population will require increasing agricultural productivity sustainably and resiliently, reducing emissions and biodiversity impacts from farming, and supporting farmer livelihoods.

Ensure access to and adoption of healthier, more sustainable diets for all

Dietary shifts are key to equitably feeding a growing population, protecting biodiversity and limiting warming to 1.5°C. This requires advancing global nutrition, improving food security in low-income and under-consuming populations, and moderating consumption of emissions- and land-intensive foods, like beef, in high-consuming regions.