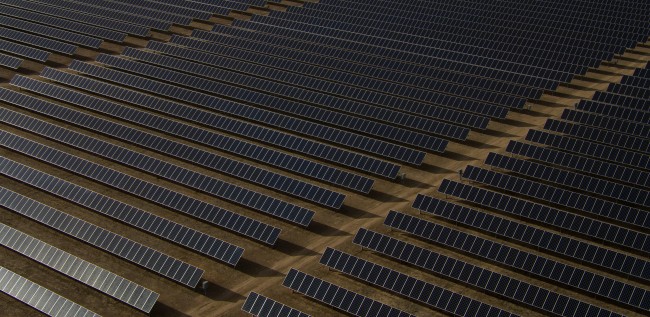
The global power sector is in the midst of a major transition. From 2019 to 2020, renewables made up 90% of all new power generation capacity. The costs of wind and solar power have fallen dramatically over the last decade. The investment shift is already yielding positive impacts: the carbon-intensity of the global power system — the amount of carbon dioxide (CO2) emitted per unit of electricity generated — has fallen by more than 15% since 2000, although overall emissions by the sector have grown by around 3.2 gigatonnes of CO2 equivalent (GtCO2e) in the same time frame. 

Accelerating this decarbonization trend is fundamental to meeting the ambitions of the Paris Agreement. In fact, strategies for systems such as industry and transport are contingent upon the power system’s decarbonization. 

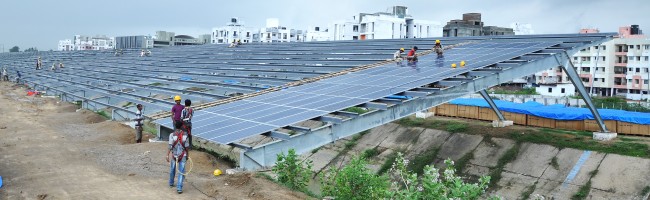
Countries need to set ambitious plans to achieve rapid and large-scale deployment of zero-carbon power

National plans to scale zero-carbon electricity generation now exist over most of the globe. At least 160 countries have outlined plans to replace fossil fuel power with lower carbon alternatives. While these commitments are important, they are not being put into practice fast enough. 

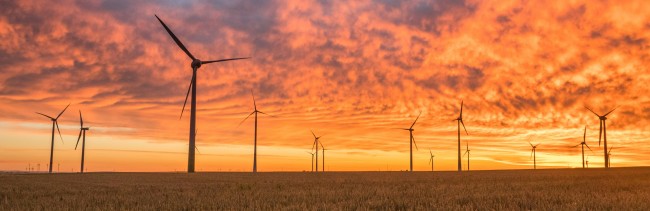
The share of zero-carbon power in global electric generation has been steadily increasing since 2011 and now stands at 39%, but it must accelerate. Collectively, governments, businesses and households must prioritize a rapid transition to more sustainable forms of energy, unlocking myriad benefits such as lower CO2 emissions, cleaner air, more resilient water resources and a net-benefit to the global economy.

Data Insights

What targets are most important to reach in the future?

Systems Change Lab identifies 4 targets toward which to track progress. Click a chart to explore the data.

What factors may prevent or enable change?

Systems Change Lab identifies 11 factors that may impede or help spur progress toward targets. Click a chart to explore the data.

Progress toward targets

Systems Change Lab tracks progress toward 4 targets. target. Explore the data and learn about key actions supporting systems change.

Share of zero-carbon sources in electricity generation

The share of zero-carbon power has been increasing since 2011, but exponential growth will be necessary by 2030 to align with Paris Agreement-compatible pathways.

The share of zero-carbon sources in global electricity grew slightly in 2022 to reach 39%, a continuation of recent trends. However, the world needs to increase the share of zero-carbon sources in global electricity to 88–91% by 2030 (a target that helps align the power sector with 1.5 degrees C-compatible pathways). 

Different zero-carbon technologies are on different trajectories. Solar power is in the breakthrough stage of an S-curve, growing exponentially over the past five years, while wind power is in the diffusion stage of an S-curve, having grown exponentially in the past but growing linearly over the last five years. Nuclear power, hydropower and other zero-carbon power sources like bioenergy have been changing linearly (or plateauing, in the case of nuclear). 

If the trajectories of each of these technologies are extrapolated, the share of zero-carbon power sources in electricity generation is making promising progress, but, though heading in the right direction, recent rates of change remain off track.

Renewables share of total capacity

Since 2012, the share of renewables in total capacity has been increasing by over 3% per year, and estimates from 2022 show 40% of total installed capacity is renewable. This growth needs to be further accelerated.

In a zero-carbon power system, the majority of electricity will need to be generated by renewable energy technologies. To measure progress toward this goal, this indicator tracks the share of installed energy capacity that is renewable as a proportion of total installed capacity.

The share of power generation capacity contributed by renewables has been growing rapidly. Since 2012, shares have been increasing by over 3% per year, and estimates from 2022 show 40% of total installed capacity in the power sector is renewable.

Yet, this growth needs to be further accelerated. Zero-carbon power's share of generation should reach 74–92% by 2030 to align with the Paris Agreement, and renewable capacity will need to increase commensurately.

Although renewable energy capacity is growing, additional policies and investments will be required to meet global targets and displace existing fossil fuel electricity generation sources.

Annual capacity additions of renewable energy

New renewable energy capacity additions have grown at an average of 11% per year over the past decade, hitting over 290 gigawatts of new renewables in 2022. To achieve a zero-carbon power system by 2050, nearly all electricity will need to come from renewable technologies.

To achieve a zero-carbon power system by 2050, nearly all electricity will need to come from renewable technologies. Achieving this will require large-scale renewable energy capacity additions. To track momentum toward this goal, it is critical to monitor annual capacity additions, which represent new installations of renewable power.

Annual capacity additions of renewables are generally increasing. Over the past decade, over 120 gigawatts (GW) of new renewable power capacity have been added each year, with these capacity additions growing at a rate of 11% per year. In 2022 alone, 292 GW of new renewable power was added, driven primarily by the expansion of renewable energy projects in Asia, but also by increasing deployment in Europe and South America. 

In 2021, the capacity additions slowed slightly. Although capacity additions rose in 2022, the small setback in 2021 highlights how major global instabilities such as the COVID-19 pandemic and Russia’s invasion of Ukraine can inhibit progress.

Renewable electricity capacity per capita in developing vs. developed countries

In 2022, the average installed renewable energy capacity per capita in developing countries is just over a quarter of that installed in developed countries. This inequity is even more stark for the least developed countries.

In 2022, the world had an installed renewable energy capacity of 3.4 terawatts (TW) of renewable electricity, representing an average of 425 watts (W) per person.

But this capacity was not distributed equitably. The average installed renewable energy capacity per capita in developing countries is just over a quarter of that installed in developed countries. This inequity is even more stark for the least developed countries.

This indicator serves as a proxy to capture the unequal benefits of renewables in developed and developing nations. While installed capacity per capita in developing countries has been growing around 10% per year in recent years, there is still a long way to go until parity is reached.

Currently, there are no agreed-upon targets for renewable energy capacity per capita for 2030 and 2050. If developing and developed nations benefited equally from renewables, this indicator would reach 100%, meaning that the installed capacity per capita was equal in developed and developing countries.

Enablers and barriers

We also monitor change by tracking a critical set of 11 factors factor that can impede or help spur progress toward targets. Explore the data and learn about key actions supporting systems change.

Number of countries with regulatory frameworks for renewable electricity generation

In 2010, just one country had a robust legal framework for renewable energy; as of 2021, conducive regulatory frameworks were in place in 46 countries, showing momentum is moving in the right direction.

Increasing renewable energy deployment requires transforming regulatory practices. Globally, energy markets and regulators have historically depended on large decentralized power assets, such as coal or gas power plants.

A diverse set of distributed power assets is beginning to enter utility portfolios and energy markets, as well as decentralized renewable energy assets. These range from large onshore wind farms to small-scale rooftop photovoltaic (PV) solar panels on homes.

To encourage the diversification of power supply, regulatory frameworks need to change to allow new technologies, market entrants or distributed generation assets to participate and compete within the electricity market.

This indicator tracks the number of countries with national regulatory frameworks that have tailored rules to incentivize increased renewable power generation.

Analysis of data from 2019 shows that momentum is moving in the right direction. In 2010, just one country had a robust legal framework for renewable energy. However, as of 2021, conducive regulatory frameworks were in place in 46 countries. Due to data and time limitations, we do not yet delve into the quality of these regulations, but this may be addressed in a future release of this platform.

Number of countries with tax incentives for renewable electricity generation

Data from 2022 shows that 53 countries had tax incentives for renewable energy. Tax incentives for renewable energy generation are a win-win: they increase profit margins for sustainable energy companies and reduce costs for consumers.

Tax incentives for renewable electricity generation help renewable generators become economically competitive with existing power plant assets that often have benefited from years of government subsidies.

Renewable incentives come in many different shapes and forms, such as removing value-added tax on renewable energy equipment or reducing corporate taxes for renewable energy companies. Tax incentives for renewable energy generation are a win-win: they increase profit margins for sustainable energy companies and reduce costs for consumers, thus promoting the development of the sector.

This indicator tracks countries offering tax incentives for the clean energy sector. Analysis of 2022 data shows that 53 countries had tax incentives for renewable energy in force. Due to data and time limitations, we do not yet delve into the quality of these tax benefits, but this may be addressed in a future release of this platform.

Number of countries with renewable energy generation/capacity targets

The latest estimates show that renewable energy targets, a crucial tool for galvanizing change and influencing decision-makers, now cover most of the globe. As of 2022, there were 175 countries with quantified renewable energy targets.

National-level targets set a clear and ambitious course for increasing renewable energy generation over time. They send a strong signal to the economy for a future energy shift.

Targets can galvanize societal change, influencing energy sector decision-makers and investors. By emphasizing renewable energy technologies rather than fossil fuels, they help avoid the risk of overinvestment in fossil fuel power sources and their associated carbon.

The latest estimates show that renewable energy targets now cover most of the globe: as of 2022, there were as many as 175 countries with quantified renewable energy targets.

We do not yet explore the quality of these targets in relation to the Paris Agreement, which is a critical component that may be explored in future analyses. A sufficient renewable energy target should be ambitious enough to achieve deep decarbonization at the speed necessary and backed by clear policy and implementation strategies.

Corporate procurements of renewable energy

Just as renewable energy capacities have grown worldwide, so too have corporate procurements of renewable energy, increasing by over 300 times from 2010 to 2021.

Corporate procurement departments are responsible for sourcing and purchasing a broad array of goods and services to meet the needs of the company, including securing its energy supply. To align with the net-zero agenda, renewable energy procurement is an essential part of corporate energy strategies. Because commercial energy consumption can represent a large proportion of global carbon emissions, such strategies could make a substantial contribution to decarbonization in certain countries.

There are four primary approaches to corporate renewable power purchasing. The options available to companies are often linked to the regulatory regime and rules in each country or jurisdiction where that company operates.

First, companies might consider using on-site power at their facilities — often called captive power or “behind the meter” power. Second, they might enter into direct power purchase agreements with developers. Third, companies might take advantage of specialized tariff programs offered by utilities to help expand renewables.

Fourth, in some cases, where renewable corporate energy procurement is not allowed or the company does not find another option, companies may use renewable energy certificates; this involves “matching” their demand in that location with a renewable energy certificate from another market. These activities require additional review and accounting to avoid double counting.

Just as renewable energy capacities have grown worldwide, so too have corporate procurements of renewable energy. In 2010, total corporate procurements stood at just 0.1 gigawatts (GW); by 2021, that figure had increased over 300 times to 31 GW.

Currently there is insufficient global data to relate renewable energy procurements to the total procurements of energy by corporate entities across these various purchasing approaches.

Share of power sector emissions covered by carbon pricing

Carbon pricing can incentivize climate change mitigation action and shift the external costs of carbon dioxide emissions back to the polluting source, sending a negative economic signal to polluters to either reduce their emissions or pay a price.

Carbon pricing generally can serve two purposes: incentivize climate change mitigation action, and shift the external costs of carbon dioxide (CO2) emissions back to the polluting source. Carbon prices send a negative economic signal to polluters to either reduce their emissions or pay a price.

Pricing mechanisms for carbon take many different shapes and forms in the power sector. Generally, they increase costs for highly polluting plants without impacting the economic performance of zero-carbon power generators.

Economists have long argued that carbon pricing is the most economically efficient mechanism to drive power sector decarbonization. This indicator seeks to quantify and track the share of power sector emissions that are covered by a carbon price; however, there is currently no reliable publicly available dataset on this indicator.

Ratio of investment in renewables vs. fossil fuels

Historically, investments in fossil fuels have far exceeded those in renewable energy. This imbalance must change in order to transform our energy system.

Investments in renewable energy technologies have grown over the past decade. Between 2013 and 2018, an average of $300 billion of finance was committed each year for renewable energy projects, predominantly directed toward solar photovoltaic (PV) and onshore wind projects. Yet, fossil fuels are still attracting a large amount of investment. The scales must tilt in favor of zero-carbon technologies in order to phase out fossil fuels and grow renewables at the pace necessary to meet the goals of the Paris Agreement.

One way to measure this shift is to track the ratio of investments in renewables as compared to that in fossil fuels. As the gap between investments into renewable energy and fossil assets shrinks, we would expect the ratio to increase, signaling a shift in the market.

Recently, there has been positive momentum: in 2015, around twice as much investment was made in renewables than in fossil fuels. Since then, renewable investments have been increasing sharply — as of 2022, around four times as much investment is being made in renewables than in fossil fuels.

While market priorities are shifting in the right direction, the amount of clean energy in the global power system needs to increase substantially by 2030 to align with the Paris Agreement.

Number of organizations offering renewable energy training

Providing workers with the skills needed to perform the jobs and activities related to new careers, like those related to renewable energy, is a crucial component of a just transition.

Workers need new skills to perform jobs and activities necessary for future careers, like those related to renewable energy. The creation of opportunities for training and support is a crucial component of a just transition.

Employment opportunities and labor income are directly related to the skills and qualifications of workers. The acquisition of labor skills in renewable energies is essential to combat future employment challenges, especially as the world continues to shift away from fossil fuels in its efforts to reduce emissions.

A qualified labor force is key to achieving a growth in employment, labor productivity and real wages. Companies internalizing the costs of training demonstrate a desire to improve human capital, retain workers and increase global productivity.

There is currently no publicly available data on the percent of firms offering training and workshops in renewable energy skills.

Number of jobs in renewable energy industry

Worldwide, employment in renewable energy was estimated at nearly 13 million in 2021. Women account for one-third of the global renewables workforce, but their participation varies widely among countries.

The increasing number of jobs for men and women in renewable energy shows that greener energy can create decent and productive work opportunities. This is central to a just transition strategy.

The renewable energy jobs created must be quality jobs and accomplish basic rights. New employment opportunities should provide men and women with decent work, meaning that they should offer fair compensation, safe working conditions, equal opportunities and social protection. These jobs must be free of forced and child labor, and provide employees the right to organize or discuss work-related issues, among other conditions. The biofuels sector, which includes a significant portion of rural employment, is likely to suffer from decent work deficits.

Global employment in renewable energy was estimated at 12.7 million in 2021, up from 7.3 million in 2012 when it was first measured. Of the nearly 13 million jobs, the four largest employment sub-sectors within the renewable energy industry are solar photovoltaic (34%), bioenergy (27%), hydropower (19%) and wind energy (11%).

Meanwhile, women account for 32% of the global renewables workforce, but their participation varies widely among countries. Due to data and time limitations, we do not yet delve into the quality of these jobs, but this may be addressed in a future release of this platform.

Total annual investment in zero-carbon power systems

Meeting the Paris Agreement requires a major transformation of the power sector. This will require significant annual expenditure into zero-carbon generation, electricity grids, and storage and flexibility, which will need to grow from the $1.1 trillion invested in 2022 to $2.4 trillion per year by 2050.

The power sector emits 23% of global greenhouse gas emissions. Decarbonizing the sector requires massive investments into zero-carbon energy generation, particularly solar and wind, as well as auxiliary infrastructure such as energy storage, transmission and distribution lines.

Total investments in a zero-carbon power system, including zero-carbon generation, transmission, distribution and storage, grew from $686 billion in 2015 to $1.1 trillion in 2022. Investments in storage grew the fastest, at an average of 46% per year from 2015 to 2022. The Energy Transitions Commission estimates that $2.4 trillion in investments will be needed per year between now and 2050, with $1.3 trillion going to zero-carbon generation, $0.9 trillion going to transmission and distribution, and $0.2 trillion going to storage and flexibility.

Cost of capital for renewable energy projects

The average cost of capital for renewable energy, including solar and wind, has fallen steadily over the last decade and dropped from 7.6% in 2010 to 3.9% in 2022.

Private investment in a company or project involves two types of parties: investors providing equity who bear more risk but expect higher returns, and lenders providing debt who bear lower risk but expect lower returns. The cost of capital reflects the perceived risk of investing in different technologies, and is affected by factors like regulatory regimes, economic conditions such as inflation or currency fluctuations, and the credit ratings of the utilities buying power from power projects. 

As financial institutions become more comfortable with low-carbon technologies, the cost of capital for related companies and projects declines. This makes it a crucial finance indicator to track how clean energy and other technologies in the low-carbon economy are attracting capital and scale.

Cost of capital is especially important for low-carbon technologies with high upfront costs, like renewable energy. Some factors can increase the cost of capital for all investments, and create disadvantages for these technologies that require higher upfront investments. Economic cycles may cause the cost of capital to increase over certain periods of time, for example, and developing markets have additional real and perceived risks that raise their cost of capital.  

The energy transition will accelerate in each market with access to cheap capital as the cost of financing zero-carbon technologies declines relative to high-carbon ones. The global average cost of capital for renewable energy (solar as well as onshore and offshore wind) has fallen steadily over the last decade and dropped from 7.6% in 2010 to 3.9 in 2022. In some countries, the cost of capital for a renewable power project is at the same rate or lower than its fossil fuel-powered equivalent. For example, in Brazil, the cost of capital for a gas-fired power plant in 2021 was 14-14.5%. The cost of capital for a solar plant in the same year was 12.5-13.5%.  

Renewable energy permitting process duration

National permitting procedures for construction of renewable energy projects are slow and thwarting construction-ready projects. The average duration of permitting processes for renewable energy projects needs to fall sharply across the world.

Renewable energy technologies, especially solar photovoltaic (PV) and wind, will make up the dominant portion of the energy mix in a Paris Agreement-aligned power sector. Achieving this will require building massive quantities of renewable energy projects at unprecedented pace and scale. 

Yet, the construction of renewable energy projects is being thwarted by existing permitting procedures in many parts of the world. For example, recent analysis shows it can take as long as ten years to obtain permits for onshore wind in Germany, while permissions for solar projects in the United States can require up to five years. As a result, many construction-ready renewable projects are currently blocked. Scaling up renewables at the pace necessary will not be possible if these lead times do not come down considerably. Countries need to urgently reform their permitting processes to enable faster deployment of renewable energy solutions.

The purpose of this indicator is to monitor the average time required to complete the permitting process for renewable energy projects country-by-country. Globally consistent data on this does not currently exist but would help measure the progress countries are making in reforming their regulatory systems. Ultimately, for a Paris Agreement-aligned energy transition, this indicator should be falling rapidly.