The rapid expansion of urban areas can lead to higher per capita urban greenhouse gas (GHG) emissionshabitat fragmentation and biodiversity loss; inefficient use of natural resources like energy, water and land; and loss of agricultural lands.

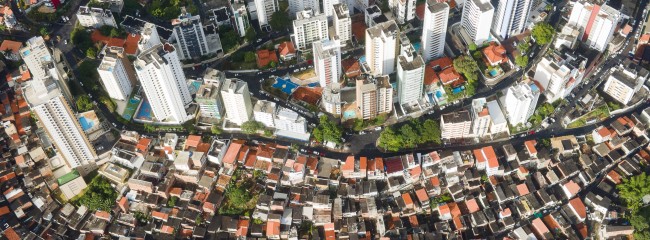
While there are multiple demographic, economic and policy drivers of urban land expansion, unplanned and unmanaged urban expansion without supporting infrastructure and services often leads to sprawling cities with spatial inequities, characterized by poor access to services and opportunities. This particularly impacts populations that were already the most vulnerable.

For example, unregulated urban expansion is often seen in rapidly growing cities of the developing world, where much urban growth occurs informally through self-built dwellings in locations prone to climate risks or in the urban periphery, disconnected from services and infrastructure. Such settlements — sometimes characterized as slums — are today occupied by more than 1 billion primarily low-income people.

This type of unregulated urban expansion reduces resilience to climate risks like flooding, heat and sea level rise as it encroaches into green spaces, biodiversity zones, coastal areas, urban flood plains and bodies of water. Some of the fastest growing urban areas are in low-elevation coastal zones and face limited water availability.

Urban land use strategies can help limit urban expansion, foster equitable access to services and opportunities, and make human settlements more climate resilient while also protecting regional ecosystems. Such strategies therefore enable cities to address climate mitigation, adaptation and equity goals all at once.

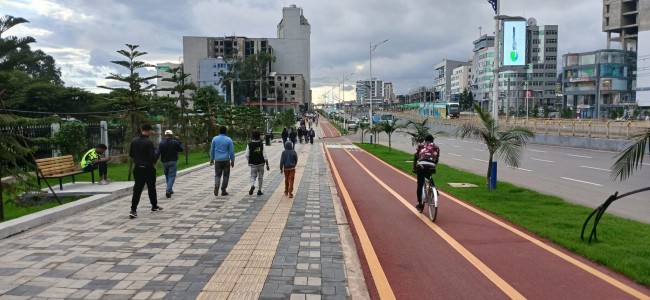
For instance, more compact and mixed land use can reduce emissions by shifting people out of cars to public transit or non-motorized transport modes such as biking, by reducing distances traveled, and by reducing the need for trips altogether. This can reduce the carbon lock-in of roads, buildings and other urban infrastructure built to service expanding areas of cities.

One example is the "15-Minute City" program in Paris, France, which is based on an urban planning concept that encourages car-centric cities to move toward mixed-use neighborhoods where residents are within 15 minutes of essential services by walking, biking or public transport.

Higher densities can improve access to the services and opportunities cities offer urban residents. However, an increase in density can also lead to an increase in housing costs, so it is important that cities incentivize and make investments in affordable housing and transport to ensure that compact cities are also affordable and livable.

Finally, preserving and enhancing green areas and water bodies makes cities more resilient to climate hazards like extreme heat and flooding. These strategies are also associated with positive human physical and mental health outcomes, economic growth, and energy and resource efficiency.

Data Insights

Is the world making enough progress toward the most important outcomes?

Systems Change Lab assesses progress made toward targets across 7 outcome indicators. Click a chart to explore the data.

What factors may enable or prevent change?

Systems Change Lab identifies 2 enablers and barriers that may help spur or impede change. Click a chart to explore the data.

Progress toward targets

Systems Change Lab tracks progress made toward targets across 7 outcome indicators. outcome indicator. Explore the data and learn about key actions supporting systems change.

Land consumption per person

Many cities are rapidly expanding outward into fertile agricultural land and biodiverse areas. However, when land is used more efficiently, less land is needed per person.

In addition to natural population increase, cities often grow to accommodate migrants coming from rural areas or other regions and countries, often in search of economic opportunities or to escape economic deprivation and climate impacts. Rapid outward expansion is greatest in lower-income cities, where population growth is also the highest. Close to 90% of urban growth by 2050 is projected to occur in Asia and Africa, where vulnerability to climate risks is also the highest.

As cities grow, many expand outward into more fertile agricultural land, and ecologically sensitive areas like forests and wetlands. The resulting expansion of built areas can encroach on natural lands and habitats important for climate resilience and biodiversity. At the same time, expanded built areas increase impervious surfaces in cities (such as roads, buildings and concrete), which absorb heat and radiate it back into the urban environment, leading to higher localized heat intensity.

There is value to densifying the built environment rather than growing outward, as this shortens distances between locations and ensures more efficient and cost-effective provision of infrastructure, which in turn improves accessibility. Much empirical evidence illustrates how a city’s spatial expansion and reduced population density increases its per capita costs to provide public services, as well as the social costs associated with higher emissions, congestion, pollution, loss of productivity and unsustainable consumption of land and natural resources.

However, density does not automatically imply very tall buildings, as these are associated with higher construction and other costs, even if the land costs may be lower. Increased density can also lead to increased housing costs, which can exacerbate inequities within cities. For residential housing in particular, cities must balance both livability and affordability as they plan for denser urban environments.

This indicator, land consumption per person, measures how much land (in square meters) is used per person. In 2020, the global average land consumption per person in urban areas was 45.5 square meters per person. This shows a slight decrease from 45.7 square meters per person in 2015. However, from 2000 to 2015, land consumption per person had increased from 43.7 square meters per person to 45.7. Over time, ideally the land consumption per person will decrease or at least remain level, as it did between 2015 and 2020.

Urban GHG emissions per capita

Cities account for over 70% of global CO2 equivalent, and a decrease in urban emissions is vital for halving global emissions by 2030.

Emissions per capita represent the nature of the infrastructure and the economy in a given geographical region, as well as individual lifestyle choices. Frameworks such as the Global Protocol for Community-Scale Greenhouse Gas Inventories help cities to measure their emissions across three scopes.

According to the IPCC, cities account for over 70% of global carbon dioxide equivalent (CO2e) across all three scopes of emissions. This indicator, however, measures only scope 1 greenhouse gas (GHG) emissions, which are from sources located within the city boundary. This does not include scope 2 emissions (which occur from grid-supplied energy) or scope 3 emissions (which occur outside the city boundary but are the result of activities within the city boundary, such as waste treatment or transboundary transportation). While not specifically urban, the power system includes indicators related to emissions from grid-supplied energy.

When it comes to emissions from scopes 1 and 2, cities can sometimes produce half the GHG emissions of suburban neighborhoods thanks to more walking and cycling infrastructure, greater public transport, and building forms that minimize the need for space heating and cooling. As a result, per capita GHG emissions are lower in many cities than they are on average in the nations where these cities are found. Additionally, cities in developed countries produced nearly seven times more emissions per capita than cities in African countries, which is the lowest emitting region.

However, there is also a risk that urbanization can lead to increased GHG emissions as residents of the city consume goods and services produced outside the city boundaries. Consumption-based GHG accounting is therefore an alternative approach to measuring city GHG emissions.

In 2020, the global average for urban GHG emissions per capita was 2.66 tonnes of CO2e (tCO2e), down slightly from 2.68 tCO2e in 2015 but up from 2.09 tCO2e in 2000.

There is no agreed-upon global target for urban GHG emissions per capita. However, to remain in line with global climate goals, urban emissions need to decrease significantly.

Change in average height of urban buildings over time

An increase in the average height of urban buildings indicates a more efficient use of land to accommodate human populations, reducing travel distances and emissions.

As cities expand, they can grow outward (horizontally) into areas that were previously vegetated and negatively impact natural services and ecosystems. However, they can also grow upward (vertically) through redevelopment of city centers and increased density. Many remote sensing studies look only at the former and not the latter. However, urban growth is more accurately measured by examining both its outward and upward dimensions.

This indicator is a measurement of upward growth at the city level, while a separate indicator on land consumption measures outward growth. An increase in average building height can translate into a more efficient use of land to accommodate human populations. It reduces travel distances and their associated emissions and can increase climate resilience by limiting outward expansion into natural lands.

However, taller buildings may increase embodied and operational building emissions. An analysis of 499 cities between 2001 and 2009 also found that upward growth often costs more than outward growth because it occurs in already built-up and well-serviced locations, and therefore is often associated with higher levels of income. A balance between these trade-offs may be achieved by providing affordable housing through medium building heights, connected to transport and other services, while meeting minimum standards of livable space per person.

There is no data for this indicator because publicly available data is not sufficient to make accurate measurements. Another measurement for upward growth is built-up volume; however, there is insufficient time-series data globally to calculate it.

Average heat island intensity of urban built-up land

Due to heat island effects, urban residents are often exposed to greater heat hazards than those in nearby non-urban areas, and marginalized communities in cities are often the most exposed. Heat intensity is also expected to increase due to climate change.

Extreme heat kills over 400,000 people around the world annually. Buildings, roads and other urban infrastructure absorb and re-emit heat more than natural landscapes do, causing the urban heat island effect. Heat islands also contribute to higher levels of air pollution. This means that urban residents are often exposed to greater heat hazards than those in rural areas. Climate change is expected to further exacerbate this issue in cities — deaths from heat are estimated to grow by 50% by 2050.

People in developing countries are expected to face the most health impacts caused by climate change-induced extreme heat. Additionally, marginalized communities in cities — which often consist of people living in informal settlements built with poor quality materials like metal sheets — are often more exposed to extreme heat.

As extreme heat events become more frequent because of climate change, cooling needs will increase in many cities, which will lead to further energy consumption for cooling appliances and, consequently, increased emissions. Cities can dramatically lower their temperatures by considering new ways of increasing and conserving land cover, such as green and blue space through nature-based solutions, and by installing cool infrastructure, such as solar-reflective materials.

Heat intensity measures extreme heat by looking at the difference in temperature between built-up areas and non-built-up areas. Positive values correspond to a more extreme urban heat island effect.

In 2020, average heat intensity of urban built-up land globally was 1.52 degrees C (2.7 degrees F) during the day and 0.72 degrees C (1.3 degrees F) at night. Since 2010, there has been no significant change in heat intensity during the daytime or at night.

While this indicator looks at both daytime and nighttime temperatures, increases in nighttime temperature can lead to additional health risks and therefore nighttime temperature is the primary measure used to calculate this indicator’s trend and status. Nighttime temperatures decreased slightly from 0.76 degrees C (1.4 degrees F) in 2015 to 0.72 degrees C (1.3 degrees F) in 2020. 

While there is no global target for heat intensity, we should strive for a decrease in heat intensity to prevent heat-related health and climate risks. Although the change in nighttime temperature was small, it is still a decrease and therefore headed in the right direction.

Share of urban land that is vegetated

Protecting and increasing the amount of vegetated areas can help cities reduce their urban heat island effect, protect biodiversity and mitigate flooding.

Urban areas are expected to triple in size between 2000 and 2050, with much of this expansion occurring in neighboring fertile and biodiverse areas. This expansion threatens vegetated areas, which provide many benefits to cities. Vegetated spaces help reduce the average heat intensity in cities and aid in flood mitigation by increasing water infiltration into the ground.

Green spaces within cities, globally, are on average 0.94 degrees C (1.692 degrees F) cooler than impervious areas. Green spaces also provide several benefits to biodiversity, such as nutrient recycling, soil conservation and microclimate regulation.

However, access to green space within cities is often inequitable. Low-income neighborhoods frequently have less access to green spaces and a reduced urban tree canopy.

Cities need to increase the number and scale of vegetated areas and protect existing ones, ensuring that all urban dwellers have access to green space. Green spaces should also be strategically linked to avoid fragmentation and promote continuity of natural habitats and ecosystem services.

This indicator tracks how much urban land is green or vegetated space. Using geospatial data allows us to calculate the areas that appear green, denoting vegetation. However, this same vegetation can change in its “greenness” from year to year due to weather changes, such as droughts.

There is no reliable global dataset for this indicator because the changes in greenness due to these weather changes makes it difficult to establish a reliable trendline.

Level of air pollution in urban areas

In 2020, an average urban area saw 279 days that exceeded the World Health Organization (WHO) guidelines for any one of six air pollutants, significantly above the target of 0 exceedance days.

Air pollution is one of the greatest environmental risks to health, with ambient (outdoor) air pollution estimated to have caused 4.2 million premature deaths worldwide in 2019. Over 80% of those premature deaths occurred in low- and middle-income countries. A World Bank report estimated that the cost of the health damage caused by air pollution amounts to $8.1 trillion a year, equivalent to 6.1% of global gross domestic product (GDP).

Although air pollution and climate change are often addressed separately in global and local contexts, air pollutants and greenhouse gasses frequently come from the same sources, including coal-fired power plants and fossil-fueled vehicles.

This indicator measures the number of days that exceeded the World Health Organization (WHO) thresholds for six pollutants in urban areas: nitrogen dioxide (NO2), sulfur dioxide (SO2), ozone (O3), carbon monoxide (CO), fine particulate matter (PM 2.5) and coarse particulate matter (PM10). The indicator is based on exceedance days in one year for any of the six pollutants in urban areas. For the country totals, it sums the number of exceedance days in all urban areas within the country in a given year (here shown as 2020, the most recent year of data available).  The global number is an average of the number of exceedance days in all the countries. There was an average of 279 exceedances in urban areas in 2020. This is down from 288 exceedance days in 2015 and 292 days in 2010.

However, the WHO global air quality guidelines call for 0 exceedance days, so while the number of exceedance days has been trending downward over the past 10 years, much progress is still needed. Given the difficulty of reaching the air quality guidelines, the WHO has a series of interim targets that can be used as milestones on the way to achieving the guidelines in the future.

Limitations: This indicator does not show how much the pollutants have exceeded the WHO thresholds. An urban area could decrease the concentration of air pollutants, but still exceed the WHO threshold; for example, this instance would be shown as an exceedance day, and the progress in the right direction would not be captured. The level of concentration of each pollutant, rather than just the exceedance days, is important for determining public health outcomes, and a future indicator will be added to address this.

Percent of urban population living in slums or informal settlements

In 2020, 24.2% of the urban population globally lived in slums or informal settlements, but progress to decrease the incidence of slums needs to accelerate more than tenfold in order to reach zero by 2030.

It is estimated that at least 1 billion people globally live in informal settlements or slums — unplanned areas that fall outside of legal and regulatory systems — and the actual number is likely much higher.

These communities lack access to adequate basic services and infrastructure like good quality housing, water, sanitation, energy or transportation, and are often located in parts of the city that are under-served and highly vulnerable to environmental and climate risks.

Local governments often overlook the deprivations faced by residents of informal settlements, who are typically from the lowest socioeconomic classes, lack legal property rights and remain uncounted in formal surveys and censuses. These settlements are unplanned areas that fall outside legal and regulatory systems and highlight the immense inequalities in access to services and infrastructure in cities.

Rapid urbanization, ineffective planning, lack of affordable housing and lack of effective housing policy are some of the reasons cited for slum formation in developing countries. If this type of growth continues, cities in developing countries could see the rise of mega-slums that are vastly under-served. Research shows that a 1% increase in urban population growth will increase the incidence of slums in Africa and Asia by 2.3% and 5.3%, respectively.

In 2020, 24.2% of the urban population globally lived in slums or informal settlements. Sustainable Development Goal (SDG) 11.1.1 aims to ensure access for all to adequate, safe and affordable housing and basic services and upgrade slums by 2030, thereby setting a target for this indicator of 0% by 2030. While this number has been trending downward, from 31.2% in 2000, the world would need to accelerate progress to decrease the incidence of slums by more than 10 times the current pace to reach 0% by 2030. However, 2 billion more people are expected to live in slums in the next 30 years.

Enablers and barriers

We also monitor change by tracking a critical set of 2 enablers and barriers enabler or barrier that can help spur or impede change. Explore the data and learn about key actions supporting systems change.

Number of countries with national urban policies

National urban policies can serve as guidelines and incentives for city-level policies that promote compact and transit-oriented development.

City governments do not work in isolation, and often they lack the power, jurisdiction or resources to make needed changes on their own. Research for the Coalition of Urban Transitions has found that 37% of urban climate mitigation potential (excluding decarbonization of electricity) requires collaboration between national, state and city governments.

Regional collaboration is vital for the integration of urban transportation and land use but can be difficult to achieve without proper regulatory and institutional coordination mechanisms. National urban policies can promote multi-level governance and vertical alignment across levels of government. They can serve as guidelines for city-level policies that promote compact and transit-oriented development.

Integration of transport and housing policies at the national level, meanwhile, can support the creation of more compact and better-connected cities. This can significantly aid cities in addressing affordability and equity concerns.

The National Urban Policy Database shows that as of 2021, 162 countries had partial or explicit national urban policies.

Number of countries with nationally determined contributions (NDCs) that include actions related to urban form

Given the important role of cities in both mitigation of and adaptation to climate change, it is vital that countries integrate practices that improve urban land uses and increase accessibility into their nationally determined contributions.

Nationally determined contributions (NDCs) are national climate action plans to cut emissions and adapt to climate impacts; they are required for each country that has ratified the Paris Agreement. Countries are required to update their NDCs every five years. Given the important role of cities in both mitigation and adaptation to climate change, it is vital that countries integrate into their NDCs practices that improve urban land uses and increase accessibility.

The United Nations Human Settlements Programme (UN-Habitat) analyzed the urban content in the 193 NDCs submitted to the UNFCCC in 2022. Their analysis found that 64% of those NDCs contained strong or moderate urban content. Compared to an analysis of NDCs from 2016-17, the number of NDCs with urban content has increased only slightly, but the percentage of NDCs considered to have strong urban content increased from 14% to 24%, which suggests an increase in recognition of cities’ central role in climate action.

This indicator measures NDCs that have actions related to urban form through data of the NDCs that have linkages to the 10 targets of Sustainable Development Goal (SDG) 11, which aims for inclusive, safe, resilient and sustainable cities by 2030.

In 2021, 157 out of 195 NDCs had a linkage to SDG 11, which shows that a high percentage of countries are now considering urban form in their climate action plans at the national level. However, unlike the UN-Habitat analysis above, this data does not show how strong the urban content is within those NDCs, just that any link to SDG 11 exists.

The NDCs still need to be translated into action in cities. In December 2023, the COP28 Presidency under the UNFCCC launched the Coalition for High Ambition Multilevel Partnerships for Climate Action (CHAMP), adopted by over 70 countries. CHAMP’s goal is to drive greater collaboration between national and subnational governments — including cities, towns, states and regions — in the planning, financing and implementation of climate strategies. This commitment from countries is meant to provide impetus to include actions focused on cities in the next round of countries’ NDCs.