In most sectors, greenhouse gas (GHG) emissions come from the combustion of fossil fuels. In these cases, electrification and the direct use of renewable energy are prime solutions for decarbonization. Even though eliminating energy-related emissions will make an important contribution, process emissions resulting from chemical reactions in various industrial processes make up a substantial part and will also need to be tackled.

Industrial process emissions cannot be tackled by decarbonizing the energy supply and need new solutions and methods

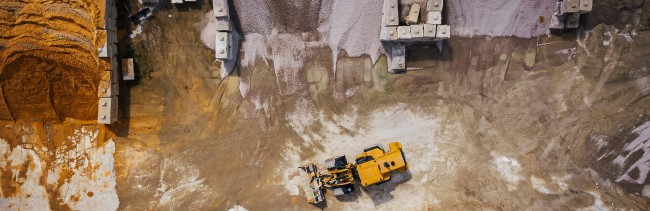
Many industrial subsectors involve the chemical processing of raw materials, such as iron ore or limestone. That process typically releases carbon from the raw material into the atmosphere, resulting in carbon dioxide (CO2) emissions. These emissions, commonly referred to as process emissions, cannot be eliminated by decarbonizing the energy supply.

Cement, steel and chemicals are responsible for about 70% of industrial CO2 emissions. A significant share of those emissions are process emissions, and plastics production is one of the major emissions sources in the chemicals industry. Thus, the adoption of alternative methods to create cement, steel and plastics while lowering industry’s climate impact is crucial. Pathways toward this goal vary depending on the product and all are in different stages of technological development

For some industrial processes, such as steel production, switching to carbon-free feedstocks like green hydrogen is a viable solution. For other processes, such as cement production, few scalable options exist today. Carbon capture and storage (CCS) is likely to play an important role. CCS could also become crucial for the decarbonization of industrial plants with long lifespans, or those that are located in geographies with limited ability to produce or obtain carbon-free feedstocks. 

Most solutions to mitigate process emissions need to be commercialized and coupled with the development of appropriate infrastructure

Most of the novel technologies that eliminate process emissions are still early in their development and will need accelerated scaling and commercialization. However, their progress will depend on access to finance, effective policies and increased demand for low-carbon industrial products. 

In addition to the adoption of novel technologies, the development of new infrastructure — for example, to transport and store captured carbon and green hydrogen — will be an important step. The supply of green hydrogen itself must be ensured while making it cost-competitive with fossil fuels and feedstocks. 

Because the manufacture of steel and cement generate high levels of process emissions, it is important to monitor each industries’ progress in lowering these levels. Green hydrogen production must also be tracked, given its expected role in mitigating process emissions in industry. 

Data Insights

What targets are most important to reach in the future?

Systems Change Lab identifies 7 targets toward which to track progress. Click a chart to explore the data.

What factors may prevent or enable change?

Systems Change Lab identifies 30 factors that may impede or help spur progress toward targets. Click a chart to explore the data.

Progress toward targets

Systems Change Lab tracks progress toward 7 targets. target. Explore the data and learn about key actions supporting systems change.

Cement

Carbon intensity per ton of cement

While the carbon intensity of global cement production has declined over the last couple of decades, improvements need to accelerate by a factor of more than 10 to reach targets compatible with the Paris Agreement.

The carbon intensity of cement measures the average amount of CO2 emitted for each ton of cement produced. That includes direct emissions from fuel combustion, process emissions and indirect emissions from electricity consumption. 

The carbon intensity of global cement production declined continuously in the last couple of decades, however, the rate of change has leveled off in recent years as the energy efficiency of the equipment used for cement production nears optimum levels

Even if the decline in carbon intensity continues at the pace set between 2015 and 2019, it would still decrease only marginally and fall far short of the 2030 and 2050 climate targets. Targets compatible with the Paris Agreement's long-term temperature objective require the carbon intensity of cement to reach 360–370 kg CO2/metric ton in 2030 and 55–90 kg CO2/ metric ton in 2050, with an aspirational target of net zero emissions in 2050. 

Given these targets, this indicator is well off track. For industry to follow a 1.5 degrees C-compatible pathway, improvements in the carbon intensity of cement need to accelerate by a factor of more than 10. 

CO2 emissions from cement production

Direct CO2 emissions from global cement production have more than doubled since 2000 and continue to rise; in 2020, they reached 1,590 megatonnes of CO2.

The total amount of CO2 emissions generated by global cement production includes direct emissions from fuel combustion, process emissions and indirect emissions from electricity consumption. Direct CO2 emissions from global cement production have more than doubled since 2000 and continue to rise. In 2020, they reached 1,590 megatonnes of CO2 (MtCO2). 

In addition to tracking the carbon intensity of cement, this indicator provides a picture of whether changes in the demand for cement are outpacing advances in the carbon intensity of cement. It also tracks the industry’s contribution to global emissions. 

Due to the lack of appropriate Paris-compatible targets, we can’t calculate an acceleration factor or evaluate whether this indicator is on track. However, emissions are rising despite a decline in the carbon intensity of cement production, meaning that total cement production is currently offsetting improvements.

Steel

Carbon intensity per ton of steel

The average rate of change over the last five years suggests that global efforts to reduce carbon intensity of steel production are heading in the wrong direction, and if these trends continue, 2030 and 2050 targets will not be met.

The carbon intensity of steel measures the average amount of CO2 emitted per metric ton of steel produced, and considers both primary and secondary steel production. Primary steel production refers to steel produced through the reduction of iron ore which is then processed into steel, while secondary steel production refers to the recycling of scrap steel into useful steel again. It includes direct emissions from fuel combustion, process emissions and indirect emissions from electricity consumption. 

The carbon intensity of global steel production has remained fairly steady, declining by 1% annually between 2015 and 2018 and then rising by 2% annually from 2018 to 2020. It reached 1,890 kg CO2 / metric ton in 2020. The average rate of change over the last five years suggests that global efforts to reduce it are heading in the wrong direction, likely the result of an increased share of blast furnace-based steel production. 

If recent trends continue, the carbon intensity of global steel production will continue to rise and the 2030 and 2050 targets will not be reached; the targets require that the carbon intensity declines to 1335-1350 kg CO2 / metric ton of steel and 0-130 kg CO2 / metric ton of steel, respectively.

CO2 emissions from steel production

CO2 emissions from steel production are growing, reaching about 3,551 MtCO2 in 2020. Although there is no Paris-compatible targets for this indicator, it is crucial to track in order to understand the relationship between changes in demand and carbon intensity.

Total CO2 emissions from global steel production include direct emissions from fuel combustion and process emissions, as well as indirect emissions from electricity consumption. Due to limited progress to-date in reducing the average carbon intensity of steel production, combined with increased global steel production, CO2 emissions from steel production are growing, reaching about 3,551 MtCO2 in 2020. 

Tracking total CO2 emissions from steel production provides a picture of whether changes in the demand for steel outpace advances in the carbon intensity of steel, which is not captured in the CO2 intensity indicator. It also measures the industry’s contribution to global emissions. 

Due to the lack of appropriate Paris-compatible targets, we can’t calculate an acceleration factor or evaluate whether this indicator is on track.

Production of near-zero emission ore-based steel

For the steel sector to significantly lower its climate impact, a shift to new, low-carbon technologies will be necessary.

Emissions from traditional steel technology (blast furnaces to basic oxygen furnaces) can only be reduced to a limited extent. For the steel sector to significantly lower its climate impact, a shift to new, low-carbon technologies will be necessary. 

By tracking the share of steel that is produced using low-carbon technologies and delivering deep emission cuts, we can get an indication of how fast the shift to those technologies is taking place. Because most near-zero emission steel production technologies are still in the development phase, most production today comes from pilot or demonstration projects and represents a negligible share compared to global steel production. To stay in line with a Paris-compatible scenario, production should reach 167 Mt in 2030.

Due to the lack of data, we can’t calculate an acceleration factor or evaluate whether this indicator is on track.

Hydrogen

Total installed electrolyzer capacity

Although the installed electrolyzer capacity has increased from 2015 to 2021, the current rate of change is not enough to reach the 2030 target, which requires that we accelerate progress significantly.

Green hydrogen production is facilitated by electrolyzers and clean electricity. By tracking the total installed capacity of electrolyzers, we can get a sense of how much the sector is growing, and whether it’s in line with a 1.5 degree C-compatible trajectory. 

In order to achieve our climate goals, IEA’s Net-Zero scenario estimates that the installed electrolyzer capacity needs to reach 850 gigawatts (GW) by 2030 and rise to 3,600 GW by 2050. Although the installed electrolyzer capacity has increased in recent years (from about 0.2 GW in 2015 to 0.5 GW in 2021), the current rate of change is not nearly enough to reach the 2030 target, which requires that we accelerate progress significantly. 

On a positive note, the pace of change in recent years indicates the possibility of accelerated growth and the realization of the 2030 goal. Looking at the current project pipeline, installed electrolyzer capacity could reach about 1.4 GW by the end of 2022, mainly driven by capacity expansions in China and Europe.

Reaching the 2030 and 2050 targets will require a vast expansion of renewable energy power installations. Because the price of electricity makes up most of the final cost of producing green hydrogen, regions with an ample supply of clean, low-cost renewable energies may become green hydrogen exporters

Green hydrogen production

Between 2010 and 2020, global green hydrogen production increased almost 7-fold; however, the current rate of change needs to accelerate significantly in order to reach the 2030 target.

Because there are various ways to produce hydrogen — through the use of fossil fuels, fossil fuels with carbon capture and storage, electrolyzers with dedicated clean or grid electricity, and more — tracking the production of green hydrogen is important to evaluate what methods are gaining ground. Even if green hydrogen production increases, fossil-based hydrogen production could grow at a faster pace, which would result in rising emissions. 

Global green hydrogen production has grown rapidly in recent years, though it started at very low levels. Between 2010 and 2020, global green hydrogen production increased almost 7-fold, from 0.003 megatonnes (Mt) in 2010 to 0.023 Mt in 2020. However, the current rate of change is insufficient, and needs to accelerate significantly to reach the 2030 target of 81 Mt. By 2050, green hydrogen production should reach 320 Mt annually. 

Enablers and barriers

We also monitor change by tracking a critical set of 30 factors factor that can impede or help spur progress toward targets. Explore the data and learn about key actions supporting systems change.

Cement

Global corporate research and development spending for cement

It is challenging to mitigate emissions from traditional cement production, so it is important to track development of novel technologies that will be needed to achieve decarbonization. Most of these technologies are in early phases and need additional financing.

Because mitigating emissions from traditional cement production is challenging, novel technologies will be needed to achieve decarbonization. Most of those technologies are still in the early phases and need additional financing for development and commercialization. 

Investing in low-carbon industrial plants is expensive and comes with high financial risks, which must be shared across private and public sectors. Although companies must dedicate more money to R&D, public support is essential to manage risks and reward early movers. 

The introduction of new technologies to a market that already provides the product is challenging unless they are economically competitive. Public spending can catalyze private investment and accelerate innovation, speed up financial decisions, or make up for initial cost gaps which may make the technology uncompetitive in its early stages of development.

Due to lack of data, we cannot track trends for this indicator.

Clinker-to-cement ratio

Since clinker production is responsible for about 90% of cement emissions, one of the key mitigation goals for the cement industry is reducing the share of clinker that is used per metric ton of cement.

Clinker acts as the glue in cement. Since clinker production is responsible for about 90% of cement emissions, one of the key mitigation goals for the cement industry is reducing the share of clinker that is used per metric ton of cement. 

Substituting clinker with other materials with lower carbon intensities (commonly referred to as supplementary cementitious materials) can reduce overall emissions from cement production. At the same time, it can reduce the fuel expenditures required. 

There are many reasons for variations in the clinker-to-cement ratio, including availability of supplementary cementitious materials, desired strengths of the concrete and varying cement standards across different jurisdictions. Traditionally, supplementary cementitious materials have included fly ash and slag from coal-fired power and steel production, but other materials, such as calcined clays, have gained increased attention in recent years. 

The global average clinker-to-cement ratio has declined historically, from 83% in 1990 to 75% in 2019, but remained relatively stable in the last ten years.   

Number of low-carbon cement facilities planned to become operational

Tracking the number of planned low-carbon cement facilities shows how fast the transition to novel low-carbon technologies is taking place, and helps estimate whether the expected production of low-carbon cement is in line with a 1.5 degree-C trajectory.

Tracking the number of planned low-carbon cement facilities shows how fast the transition to novel low-carbon technologies is taking place. The indicator can be used to estimate the expected production of low-carbon cement and whether it is in line with a 1.5 degrees C-compatible trajectory.

Although this indicator lacks a comprehensive data source, a growing number of companies are developing low-carbon cements and piloting CCS technologies

Production of novel low-carbon cement types

Alternative types of cements are now being developed with different raw materials than those used in traditional cement production, requiring less energy to make and generating fewer or no process emissions. To date, very few alternative cement types have been commercialized.

Alternative types of cements are now being developed with different raw materials than those used in traditional cement production. They require less energy to make and generate fewer or no process emissions. To date, very few alternative cement types have been commercialized, facing both technical hurdles and policy-related barriers, such as the development of new cement standards.

Because low-carbon cement technologies are still being developed, current supplies come from pilot or demonstration plants, and the volume is negligible compared to traditional cement production. 

The future role of alternative cements in decarbonizing the cement industry is unclear. Production could be limited by the regional availability of raw materials as well as the emission reduction potential per unit of cementitious material. However, they hold potential as a mitigation alternative to reduce dependence on carbon capture and storage.

Due to the lack of data and appropriate Paris-compatible targets, we can’t calculate an acceleration factor or evaluate whether this indicator is on track.

Cost of producing decarbonized cement

By tracking the cost of producing decarbonized cement using various technologies or production processes, we can determine how different decarbonization production routes are progressing and identify the cost gap between decarbonized and traditional cement.

Cement companies moving to low-carbon technologies take on risks because their actions can increase the price of cement. There are three main reasons: new infrastructure is costly, emerging technologies have not yet reached economies of scale, and decarbonized fuels and feedstocks are still more expensive than fossil fuels in most parts of the world. 

By tracking the cost of producing decarbonized cement using various technologies or production processes, we can determine how different decarbonization production routes are progressing and identify the cost gap between decarbonized and traditional cement.

Due to lack of data, we cannot track trends for this indicator. 

Share of alternative fuels for thermal energy in cement production

Heat generated from fuel combustion is responsible for 30%-40% of carbon emissions from cement production. The share of alternative fuels in the thermal energy mix for cement production is rising, having almost doubled in 15 years.

Heat generated from fuel combustion is responsible for 30%-40% of carbon emissions from cement production. The majority of that fuel is currently fossil fuel, but lower-carbon alternatives could be substituted, such as sustainable biomass and waste. However, because of the limited potential supply of sustainable biomass, this option isn’t a long-term solution. 

Because of the high temperatures required for cement production (about 1450 degrees C, or 2642 degrees F), electrifying that heat demand is technically challenging but possible. More development will help speed commercialization. 

Using solar heat directly could be a promising solution. In 2022, CEMEX and Synhelion successfully ran the first cement kiln powered by solar heat

Switching to higher shares of alternative fuels offers short-term mitigation potential. The share of alternative fuels in the thermal energy mix for cement production has almost doubled in 15 years, rising from 10% in 2006 to 19% in 2019. 

Number of announced low-carbon cement projects

Because the production of low-carbon cement will require the development and application of new technology, tracking the number of announced low-carbon cement facilities gives an indication of how the sector is progressing.

Because the production of low-carbon cement will require the development and application of new technology, tracking the number of announced low-carbon cement facilities gives an indication of how the sector is progressing. 

This indicator, for instance, can show how the sector reacts to policies and regulations, or other external factors which could affect low carbon development. By zeroing in on the type of technologies being considered, we can evaluate the development of specific approaches.

Due to lack of data, we cannot track trends for this indicator.

Percent of global cement production under a supporting policy for green cement production

Supporting policies for low-carbon cement are important instruments to speed up the transition to a decarbonized cement sector. Such policies could include green public procurement to increase the demand for low-carbon cement and contribute to a more secure market.

Supporting policies for low-carbon cement are important instruments to speed up the transition to a decarbonized cement sector. Such policies could include green public procurement to increase the demand for low-carbon cement and contribute to a more secure market. Leading countries in cement public procurement include France, Germany, the Netherlands, Sweden, the United Kingdom and the United States. 

Contracts-for-difference could help companies reduce the financial risks of investing in novel low-carbon technologies. A range of other mechanisms — tax incentives, low-carbon product standards and performance-based building codes — can further incentivize the adoption of low-carbon cement technologies. 

Measuring the share of global cement production that is covered by such policies helps us to track progress, identify gaps and analyze the effectiveness of various policies. 

Due to lack of data, we cannot track trends for this indicator. 

Number of cement companies setting net-zero targets

In addition to policies, companies' own targets to reduce emissions can contribute to an increased ambition loop, especially if they commit to targets that are more challenging than existing policies in place within the company’s jurisdiction.

In addition to policies, companies' own targets to reduce emissions can contribute to an increased ambition loop, especially if they commit to targets that are more challenging than existing policies in place within the company’s jurisdiction. 

A strong commitment to net-zero emissions requires companies to develop clear decarbonization roadmaps and focus on implementation, which in turn can send signals to the rest of the industry. By tracking the number of cement companies that are committing to net-zero emissions, we can get a clearer picture of the momentum toward decarbonization.

Companies committing to net-zero is a good first step which then should be followed by a strong focus on implementation to ensure that the targets can be achieved. 

Due to lack of data, we cannot track trends for this indicator.

Share of global cement production covered by a net-zero roadmap

Tracking the share of global cement production that is covered by a national net-zero roadmap allows us to estimate where the sector is heading in terms of reducing emissions, compare that to what is needed to align with a 1.5 degrees C-compatible pathway, and identify potential gaps.

National net-zero roadmaps for an industry can send clear signals to the industry in terms of the level of ambition and potential future policy measures.

Tracking the share of global cement production that is covered by a national net-zero roadmap also allows us to estimate where the sector is heading in terms of reducing emissions, compare that to what is needed to align with a 1.5 degrees C-compatible pathway, and identify potential gaps.

Due to lack of data, we cannot track trends for this indicator. 

Number of construction companies setting Science Based Targets (SBTs) accounting for scope 3 emissions

Acknowledging scope 3 emissions would indicate the future demand for low-carbon cement, which can reduce the risks associated with investing in novel, low-carbon technologies. As of July 2022, no SBTs by construction companies included scope 3 emissions.

Creating demand for low-carbon cement is key to stimulating its development. As the main cement consumer, the construction industry could have a significant impact.  

By taking responsibility for their scope 3 emissions in their emission reduction targets, building companies can accelerate demand for low-carbon cements. Scope 3 emissions include indirect emissions originating from downstream and upstream along the value chain of cement production. They include all emissions that are not scope 1 or 2 emissions. 

Acknowledging scope 3 emissions would indicate the future demand for low-carbon cement, which can help cement-producing companies reduce the risks associated with investing in novel, low-carbon technologies. As of July 2022, no SBTs by construction companies included scope 3 emissions.

Number of jobs in RDI for low-carbon cement

More information is coming soon.

More information is coming soon.

Steel

Global corporate research and development spending for low-carbon steel

Low-carbon steel technologies are in various stages of development, and speeding up their commercialization is urgently needed. The financial risks of this should be shared by public and private sectors, so corporate spending on R&D must accelerate.

Low-carbon steel technologies are in various stages of development, and speeding up their commercialization is urgently needed. Timing is critical, because there are many traditional steel plants which will reach new investment cycles within the next ten years. If low-carbon technologies are not ready to be deployed and scaled up by then, there is a risk that new investments could be directed toward carbon-intensive technologies, resulting in carbon lock-in effects.

The financial risks of investing in new industrial plants are large and need to be shared by the public and private sectors. As part of that, corporate spending on R&D must accelerate.

Due to lack of data, we cannot track trends for this indicator. 

Cost of producing decarbonized steel

By tracking the cost of producing decarbonized steel using various technologies, we can identify how fast different decarbonization technologies are progressing and quantify the cost gap between decarbonized and traditional steel; traditional steel remains the cheapest to produce as of 2020.

Steel companies switching to low-carbon technologies take risks by investing in new technologies because their actions can increase the price of steel. New infrastructure is costly, emerging technologies have not yet matured or reached economy of scale, and decarbonized fuels and feedstocks are still more expensive than fossil fuels in most parts of the world.

By tracking the cost of producing decarbonized steel using various technologies, we can get an overview of how fast different decarbonization technologies are progressing and identify the cost gap between decarbonized and traditional steel. 

In 2020, steel produced with a conventional blast furnace to basic oxygen furnace (BF-BOF) — the most emissions-intensive technology — was the cheapest way of producing primary steel on a global average at about $462/metric ton of crude steel. 

Producing primary steel with a BF-BOF equipped with CCUS would increase the price to about $736/ metric ton of crude steel. A cheaper option to produce near-zero emissions steel is to opt for green hydrogen-based direct reduced iron (DRI) at $716/metric ton of crude steel. 

The cheapest way of producing near-zero emissions steel is by producing secondary steel (scrap-EAF), which uses recycled steel scrap and costs $411/metric ton of crude steel. 

New installed capacity of steel production

More than half of added steel capacity between 2010 and 2020 was blast furnace-based, which could lead to increased CO2 emissions in the steel sector.

The economic lifetime of steel plants is long — approximately 40 or more years. That means that newly added plants are likely to stay in use for a significant period of time. New coal-intensive plants will continue to generate large amounts of emissions unless they are retrofitted with low-carbon technology or become stranded assets. 

By tracking new installed steel capacity each year, we get an indication of the size of the challenge. More than half of added steel capacity between 2010 and 2020 (about 58%) was blast furnace (BF) based, followed by scrap-based steel electric arc furnace (EAF) based production at about 28%. The continuous rise in BF-based steel capacity could increase steel sector CO2 emissions and emission intensity.

Share of secondary steel in total steel production

The most energy efficient and least energy-intensive way of producing low-carbon steel is through the recycling of scrap steel, which is collected and melted in an electric arc furnace which is run fully on electricity.

The most efficient and least energy-intensive way of producing low-carbon steel is through the recycling of scrap steel. Scrap steel is collected and melted in an electric arc furnace which is run fully on electricity. By using clean electricity to run the furnace, steel can be produced with almost no emissions. 

This technology is already commercialized and used in many parts of the world. However, production is limited by the supply of scrap steel, which varies across regions and countries. There is significant potential to increase scrap steel production, but issues such as contamination, the availability of scrap steel, poor sorting systems and high installed capacities of primary steel production can impede progress. 

According to the OECD, the share of secondary steel in global crude steel production has declined since 2000. Due to lack of data, we cannot track trends for this indicator. 

Number of announced low-carbon steel projects

The number of announced low-carbon steel projects has increased rapidly in recent years — nine in 2019, 21 in 2020 and 51 in 2021.

Because the production of low-carbon steel will require the development and application of new technology, tracking the number of announced low-carbon steel facilities provides an indication of how the sector is progressing. By zeroing in on the type of technologies being considered, we can evaluate the development of specific approaches. 

The number of announced low-carbon steel projects has increased rapidly in recent years — nine in 2019, 21 in 2020 and 51 in 2021.

Number of low-carbon steel projects planned to become operational

Of the low-carbon steel projects currently in the pipeline, 36 would be in operation by 2030, excluding an additional 13 projects with unknown start dates.

In addition to monitoring the number of announced low-carbon steel projects, tracking when those projects are slated to become operational can be useful in showing the state of the sector and how fast various technologies are developing. By tracking whether the planned projects are put in operation according to initial timelines, we can also get an enhanced understanding of how fast low-carbon steel facilities can be deployed. By studying the geographical distribution of those projects, we can also identify countries and regions where more efforts are needed. 

Of the projects currently in the pipeline, 36 would be in operation by 2030, excluding an additional 13 projects with unknown start dates. Due to the lack of appropriate targets and lack of data on the production capacity of those facilities, we cannot yet judge whether the current pipeline is in line with a Paris-compatible scenario. 

Number of steel companies committing to zero emissions steel

According to data from the Green Steel Tracker, as of June 2022, 26 steel companies had committed to net-zero emissions and another two companies had pledged 80–95% emissions reductions.

In addition to policies, companies' own targets to reduce emissions can contribute to an increased ambition loop, leading to rising momentum within the sector by committing to targets that are more ambitious than policies in place within the company’s jurisdiction. A commitment to net-zero emissions requires companies to develop clear decarbonization roadmaps and can send signals to the rest of the industry. By tracking the number of steel companies that have committed to net-zero emissions, we can get a clearer picture of the momentum toward decarbonization in the global steel sector.

According to data from the Green Steel Tracker, as of June 2022, 26 steel companies had committed to net-zero emissions and another two companies had pledged 80–95% emissions reductions. Announcements of net-zero emission plans jumped from two in 2020 to 16 in 2021. 

Committing to net-zero is an important first step, which should be followed by a strong focus on implementation to make sure that targets are achieved.    

Share of global steel production covered by national net-zero roadmaps

Tracking the share of global steel production that is covered by a national net-zero roadmap also allows us to estimate progress on decarbonization, assess what is needed to align with a 1.5 degrees C-compatible pathway, and identify potential gaps.

National net-zero roadmaps for an industry can send clear signals to the industry in terms of the level of ambition and potential future policy measures. Tracking the share of global steel production that is covered by a national net-zero roadmap also allows us to estimate progress on decarbonization, assess what is needed to align with a 1.5 degrees C-compatible pathway, and identify potential gaps. 

Due to lack of data, we cannot track trends for this indicator.

Number of automotive companies setting Science Based Targets (SBTs) including scope 3 emissions

By taking responsibility for scope 3 emissions in their emission reduction targets, auto manufacturers will let steel companies know that there will be a demand for low-carbon steel, which can help reduce the risks associated with investing in novel low-carbon technologies.

One of the key enablers to stimulate the development of low-carbon steel is to create a demand for it. As one of the main steel consumers, the automotive industry could have a significant impact on increasing this demand. By taking responsibility for scope 3 emissions in their emission reduction targets, auto manufacturers will let steel companies know that there will be a demand for low-carbon steel, which can help reduce the risks associated with investing in novel low-carbon technologies. 

There are currently no automotive companies with SBTs that include scope 3 emissions.

Number of jobs in RDI for low-carbon steel

More information is coming soon.

More information is coming soon.

Hydrogen

Global research and development spending on green hydrogen

Annual investments in electrolyzer installations from both private and public entities increased significantly the last few years: from close to zero in 2016 to roughly $1.56 billion in 2021. The 2021 total was over three times higher than the annual investments made in 2020.

The production of green hydrogen is still an emerging technology. It needs further development to improve the electrolyzer efficiency, optimize production, reduce costs and develop new infrastructure. 

Green hydrogen is becoming an area of interest for both public and private entities. In private entities, a rising interest for green hydrogen is starting to emerge among industrial companies such as steel manufacturers and chemical companies. Public interests are linked to several countries aiming to export green hydrogen or use it domestically to boost energy security. 

Further, the hydrogen economy will require the development of new infrastructure. Public investments in green hydrogen production, storage and transportation will therefore play an important role in the development of the sector. Increased corporate R&D spending on green hydrogen production can also contribute to economies of scale, increasing the viability of green hydrogen production. 

Annual investments in electrolyzer installations from both private and public entities increased significantly the last few years: from close to zero in 2016 to roughly $1.56 billion in 2021. The 2021 total was over three times higher than the annual investments made in 2020.

According to the IEA, public spending makes up a significant part of those investments and is driven by several new governmental initiatives supporting low-carbon hydrogen.

Cost of producing hydrogen

Due to increases in natural gas prices in 2022, the price of natural gas-based hydrogen and natural gas-based hydrogen produced with CCS increased, making green hydrogen the most cost-competitive option today in many regions.

Because there are various ways of producing hydrogen, the decision to use green hydrogen is likely to be based partly on its cost-competitiveness with other types of hydrogen. 

Due to increases in natural gas prices in 2022, the price of natural gas-based (gray) and natural gas-based hydrogen produced with CCS (blue) hydrogen increased. That makes green hydrogen the most cost-competitive option today in many regions. That picture might, however, change depending on potential changes in the price of natural gas. 

The cost of producing green hydrogen is expected to decrease when economies of scale and cheaper rates for renewable energy-based electricity are available. At the same time, the cost of producing gray hydrogen could increase in the long term with the implementation of new regulative policies, such as carbon pricing.  

In 2018, producing hydrogen from coal was the cheapest production method at $1.2–2.2 per kilogram (kg), followed by natural gas at $0.9–3.2/kg. Producing hydrogen with natural gas equipped with CCS cost $1.5–2.9/kg, while producing green hydrogen from renewables cost $3.0–7.5/kg. 

Average size of electrolyzer plants

The average project size of electrolyzer plants increased from 0.16 megawatts (MW) in 2009 to 0.64 MW in 2019. Several projects on the gigawatt scale are now being planned.

To achieve a major increase in the global production of green hydrogen, as required to meet 1.5 degrees C-compatible targets, the average size of electrolyzer plants (which split water into hydrogen and oxygen molecules using electricity) needs to expand. Larger electrolyzer plants can contribute to economies of scale and learning effects, and bring down the cost of green hydrogen production. 

The average project size of electrolyzer plants increased from 0.16 megawatts (MW) in 2009 to 0.64 MW in 2019. Several projects on the gigawatt scale are now being planned.

Cost of wind and solar

More information is coming soon.

More information is coming soon.

Number of governments with published hydrogen strategies

In 2019, Japan and Korea were the only two countries which had set green hydrogen strategies, but this number reached 26 by the end of 2021. BNEF estimates that an additional 22 hydrogen strategies could be published in 2022.

Governments with roadmaps or strategies for green hydrogen production send clear signals to the private sector. Often, their plans include supporting policies to reduce investment risks for private companies. Strategies may also include specific production or price targets and infrastructure development plans. 

The number of governments which have published hydrogen strategies has increased rapidly over the past few years. In 2019, Japan and Korea were the only two countries which had done so. By the end of 2021, the number of countries had increased to 26. BNEF estimates that an additional 22 hydrogen strategies could be published in 2022.  

Number of companies undertaking commitments to accelerate adoption and deployment of green hydrogen

In addition to governments, the private sector can accelerate hydrogen deployment through corporate emissions reduction commitments. As of July 2022, 34 companies had committed to accelerating the adoption and deployment of green hydrogen.

In addition to governments, the private sector can accelerate hydrogen deployment through corporate emissions reduction commitments. Either individually or through their participation in initiatives, companies are making pledges to supply or purchase green hydrogen. 

For example, at COP26, 28 companies from the energy, transport, industry and financial sectors pledged to produce, consume, or provide financial or technical support toward the development of green hydrogen. Seven companies have established a global coalition aiming to increase the production of green hydrogen 50-fold over the next six years. 

Several investment platforms that focus on advancing green hydrogen production were also established by private businesses and investment firms in 2021, signaling an uptick in private sector engagement, and at least four hydrogen companies are planning to go public in 2022. As of July 2022, 34 companies had committed to accelerating the adoption and deployment of green hydrogen. 

Number of green hydrogen projects globally to become operational

In 2021, there were more than 80 operational green hydrogen projects. As more of these plants come online, they could increase the supply of green hydrogen while also contributing to economies of scale.

The list of planned hydrogen electrolyzer projects is growing rapidly. BNEF estimates that electrolyzer sales will quadruple in 2022, driven by growing political support and an increasing demand for green hydrogen led by heavy industry. 

In 2021, there were more than 80 operational green hydrogen projects. As more of these plants come online, they could increase the supply of green hydrogen while also contributing to economies of scale. By 2030, an estimated 384 plants are planned to be in operation.

Number of jobs in RDI for green hydrogen

More information is coming soon.

More information is coming soon.