Technical Note
This technical note describes our methods for identifying key systems that must transform, identifying the most critical shifts within each system, translating these shifts into global targets, and selecting indicators with accompanying datasets that we use to monitor annual change. It outlines our approach for assessing the world’s collective progress made toward targets and categorizing recent efforts for outcome indicators as on track; off track; well off track; right direction, no target; headed in the wrong direction; or insufficient data. Finally, it details how we identify critical barriers to change and drivers that can support transformations, as well as limitations to our methodology.
This technical note covers the overall methods that we applied to all systems on the platform. The methods that are specific to each system can be found below.
Parts of this technical note are drawn from the State of Climate Action technical note, Methodology Underpinning the State of Climate Action Series: 2025 Update. While the Systems Change Lab platform focuses on systems change for limiting climate change, protecting biodiversity and improving equity, the State of Climate Action series is solely focused on a subset of the climate-related targets.
Please refer to the update log to see a list of all the updates in the 2025 technical note. Previous versions can be found here for 2024 and 2022.
System Methodology
- Power
See the technical note linked at the top of this web page for an explanation of the methodology underpinning the Systems Change Lab platform. This section explains how the methodology was applied in the power system.
Selection of Shifts
For the power system, we chose four shifts:
- Phase out coal and unabated fossil gas electricity generation
- Rapidly scale up zero-carbon electricity generation
- Modernize power grids, scale energy storage and manage power demand
- Ensure energy access and a just and equitable transition for all
Decarbonizing power generation is essential to limit global warming to 1.5˚C. These shifts were chosen to represent eliminating polluting generation sources from the system, meeting demand with zero-carbon sources, upgrading physical infrastructure to facilitate a zero-carbon system, and integrating equity and access concerns into the energy transition. Together, these actions can dramatically reduce the carbon intensity of electricity generation and ensure that no one is left behind in the transition.
These shifts conjointly provide a comprehensive picture of progress for the power system, as they represent the key changes needed to decarbonize power generation and supply.
Shifts 1–3 are primarily focused on reducing power system emissions to help limit global temperature rise to 1.5˚C, while shift 4 is primarily focused on improving equity. This system does not include any specific shifts focused on biodiversity, but as described in the following section, we did in some cases consider biodiversity as a safeguard for the other shifts (for instance, limiting biomass use as a method to reduce emissions).
Selection of Targets and Indicators
Decarbonizing power generation is essential to limit global warming to 1.5˚C. This requires transforming the sector from one that relies heavily on fossil fuels to produce electricity to another fundamentally different sector that generates zero-carbon power. Such a transition will entail both the immediate scale-up of zero-carbon power sources and the rapid phaseout of coal and unabated natural gas (IPCC 2022; IEA 2021). Together, these actions can dramatically reduce the carbon intensity of electricity generation.
To track progress made toward accelerating this sectoral transformation, we identified four key shifts laid out in major reports from the Intergovernmental Panel on Climate Change (IPCC) and the International Energy Agency (IEA), among others (IPCC 2018, 2022; IEA 2021). Indicators in shifts 1–3 measure climate outcomes as well as equity outcomes associated with their relevant shifts, and indicators in shift 4 measure equity outcomes in providing universal electricity access and managing a transition to zero-carbon electricity.
For several indicators, we adopted targets developed by Climate Action Tracker (CAT) (2023), which employed a combination of top-down and bottom-up methods to establish near- and long-term power generation targets. CAT (2023) first identified modelled pathways that limit global temperature rise to 1.5°C with no or limited overshoot from IPCC (2022) and then filtered them, following four pieces of criteria:
- Scenarios were published in or after 2018;
- Scenarios have good regional resolution;
- Deployment of bioenergy with carbon capture and sequestration is restricted to an average of 5 gigatonnes of carbon dioxide per year (GtCO2/yr) from 2040 to 2060, and carbon removal from afforestation and reforestation is limited to an average of 3.6 GtCO2/yr from 2040 to 2060 and to an average of 4.4 GtCO2/yr from 2050 to 2100; and
- Scenarios are consistent with achieving net-zero greenhouse gas (GHG) emissions in the second half of the century, as stated in Article 4.1 of the Paris Agreement.
The median value from these scenarios formed the less ambitious bound of the power sector targets’ ranges, though CAT (2023) made several key adjustments to this global median to better account for equity considerations and feasibility constraints that will likely impact many developing countries’ capacities to transform the power sector. These adjustments included assuming developed countries can reduce fossil fuels at the 75th percentile rate rather than the median rate, allowing developing countries to reduce coal at a slightly slower rate; limiting new fossil gas generation capacity and reallocating GHG savings to coal-fired power fleets; and increasing renewable energy generation to fill gaps in generation as a result of the previous adjustments.
CAT (2023) then combined this analysis of modelled pathways from integrated assessment models (IAMs) with a bottom-up review of global energy system modelling efforts, including assessments of the feasibility and cost of different technologies. It compared targets derived from this bottom-up review with those developed using the 1.5°C scenarios from IAMs (which served as a GHG emissions budget constraint). Using the adjusted median value from this filtered set of IAM scenarios as the less ambitious bound of the target range ensured compatibility with the 1.5°C global temperature rise limit, while deriving the more ambitious bound of the target range from the bottom-up review provided a feasibility constraint on the target.
Equity-related targets were established for three indicators — premature deaths from air pollution, population without access to electricity, and share of household income spent on electricity.
For all indicators, the sources and methodological approaches used are described in each indicator tooltip.
Not every indicator in the power system has an associated target. For climate-related indicators, this is because there is no general agreement in the literature on what the target should be, but the indicator was deemed important based on a review of the literature and expert elicitation. Some equity- or just transition-related indicators do not have targets because there is no general agreement in the literature about quantitative targets. The equity and just transition indicators for the power system were chosen based on the principles outlined in the Systems Change Lab technical note. Lack of data is also a methodological challenge affecting many of the indicators on equity and just transition.
Works Cited
Bauer, N., C. Bertram, A. Schultes, D. Klein, G. Luderer, E. Kriegler, A. Popp, and O. Edenhofer. 2020. “Quantification of an Efficiency–Sovereignty Trade-off in Climate Policy.” Nature 588 (7837): 261–66. https://doi.org/10.1038/s41586-020-2982-5.
Bhatia, M., and N. Angelou. 2015. “Beyond Connections: Energy Access Redefined.” Working Paper. Washington, DC: World Bank. https://openknowledge.worldbank.org/handle/10986/24368.
CAT (Climate Action Tracker). 2023. Paris-aligned benchmarks for the power sector. Berlin, Germany: Climate Action Tracker. https://climateactiontracker.org/publications/paris-aligned-benchmarks-power-sector/.
Falk, J., O. Gaffney, A.K. Bhowmik, P. Bergmark, V. Galaz, N. Gaskell, S. Henningsson, et al. 2020. “Exponential Roadmap.” Stockholm: Future Earth. https://exponentialroadmap.org/exponential-roadmap/.
IEA (International Energy Agency). 2021. “Net Zero by 2050: A Roadmap for the Global Energy Sector.” Paris: International Energy Agency. https://www.iea.org/reports/net-zero-by-2050.
IRENA (International Renewable Energy Agency). 2021. World Energy Transitions Outlook - 1.5°C Pathway. Abu Dhabi: IRENA. https://www.irena.org/publications/2021/Jun/World-Energy-Transitions-Outlook.
IPCC (Intergovernmental Panel on Climate Change). 2018. Global Warming of 1.5°C. An IPCC Special Report on the Impacts of Global Warming of 1.5°C above Pre-Industrial Levels and Related Global Greenhouse Gas Emission Pathways, in the Context of Strengthening the Global Response to the Threat of Climate Change, Sustainable Development, and Efforts to Eradicate Poverty. Edited by V. Masson-Delmotte, P. Zhai, H.O. Pörtner, D. Roberts, J. Skea, P.R. Shukla, A. Pirani, et al. Geneva: IPCC. https://www.ipcc.ch/site/assets/uploads/sites/2/2019/06/SR15_Full_Report_High_Res.pdf.
IPCC. 2022. “IPCC Sixth Assessment Report: Mitigation of Climate Change.” Geneva: IPCC. https://www.ipcc.ch/report/ar6/wg3/.
United Nations. 2015. “The 17 Goals - Sustainable Development Goals.” United Nations. https://sdgs.un.org/goals.
- Transport
See the technical note linked at the top of this web page for an explanation of the methodology underpinning the Systems Change Lab platform. This section explains how the methodology was applied in the transport system.
Selection of Shifts
For the transport system, we chose five shifts:
- Guarantee reliable access to safe and modern mobility
- Reduce avoidable vehicle and air travel
- Shift to public, shared and non-motorized transport
- Transition to zero-carbon cars, trucks and buses
- Transition to zero-carbon shipping and aviation
While technological solutions such as electric vehicles are capturing the most attention with announcements by major vehicle manufacturers and countries related to moving away from the internal combustion engine (see IEA 2021), achieving full decarbonization of the transport sector expediently and efficiently requires more than just a change in technology (BloombergNEF 2022).
We chose these shifts because they broadly follow the avoid-shift-improve framework in the transportation literature (Dalkmann and Brannigan 2014) while also accounting for equity and just transition concerns. Guaranteeing reliable access to safe and modern mobility (accessible, affordable, and zero-carbon travel) is a priority for equity. Reducing avoidable travel by vehicle and plane is a strategy to avoid travel. Shifting to public, shared, and non-motorized transport moves passengers from high-carbon internal combustion engine vehicles to more efficient, lower-carbon modes and helps address additional concerns such as traffic, air pollution, and safety. Transitioning to zero-carbon cars, trucks, shipping, and aviation improves the modes that we use to transport people and goods by lowering carbon emissions from the modes we use when we cannot shift to other modes.
Together these shifts provide a comprehensive picture of progress for the transport system because they tackle supply and demand across all major transport modes, including passenger transport and freight.
Shift 1 is focused on improving equity, while shifts 2–5 are primarily focused on reducing transport system emissions to help limit global temperature rise to 1.5°C. This system does not include any specific shifts focused on biodiversity, but as described in the following section, we did in some cases consider biodiversity as a safeguard for the other shifts (for example, limitations on biomass use as a method to reduce emissions).
Selection of Targets and Indicators
The targets and indicators used on this platform cover all three elements of the avoid-shift-improve framework (Bongardt et al. 2019). The “avoid” segment of this framework is also accounted for in the cities system because it entails urban planning and behavior changes that affect transportation infrastructure in cities.
Indicators and targets in this system minimize the use of primary biofuels because only a small amount of sustainable biomass is available for energy production in hard-to-abate sectors without jeopardizing the land and resources needed to feed a growing population (Searchinger et al. 2019).
Two of the climate-related transport system targets on this platform are derived from the Climate Action Tracker (CAT) consortium’s 2020 paper, Paris Agreement Sectoral Benchmarks: Methods Report (CAT 2020). These targets were compared with other targets in the literature from sources such as IEA 2021, IRENA 2021, and ICCT 2020. These targets were chosen because they represent the high-end of ambition within 1.5°C-compliant pathways. Using a similar approach to the power system analysis, the CAT team first considered integrated assessment models (IAMs that were able to limit warming to 1.5°C (“no overshoot” and “low overshoot” scenarios in which a brief and limited overshoot of average warming occurred). They refined their selection to include only those scenarios that assumed sustainable use of carbon removal and use of biomass. These pathways are defined on a least-cost pathway and do not consider equitable distribution of costs and required action. Finally, the CAT team also used a combination of its own bottom-up modeling (for example, for electric vehicles) and other independent literature to finalize the more disaggregated targets. Each sectoral target that was derived from such bottom-up analyses was still compared with 1.5°C-compatible IAMs to ensure that, if there were any discrepancy, it would be at least as ambitious as the IAM targets (and therefore 1.5°C-compatible).
For other targets in the transport system, the sources and methodological approaches used are described in each indicator tooltip.
Not every indicator in the transport system has an associated target. For climate-related indicators, this is because there is no general agreement in the literature on what the target should be, but the indicator was deemed important based on a review of the literature and expert elicitation. Currently, none of the equity- or just transition-related indicators have a target. This is because there is no general agreement in the literature about quantitative targets. The equity and just transition indicators for the transport system were chosen based on the principles outlined in the Systems Change Lab technical note found at the top of this web page. Lack of data is also a methodological challenge affecting many of the indicators on equity and just transition.
Works Cited
BloombergNEF. 2021. “Electric Vehicle Outlook 2021.” New York: BloombergNEF. https://about.bnef.com/electric-vehicle-outlook/.
BloombergNEF. 2022. “Electric Vehicle Outlook 2022.” New York: BloombergNEF. https://about.bnef.com/electric-vehicle-outlook/.
Bongardt, D., L. Stiller, A. Swart, and A. Wagner. 2019. “Sustainable Urban Transport: Avoid-Shift-Improve (A-S-I).” Bonn and Eschborn, Germany: TUMI. https://www.transformative-mobility.org/assets/publications/ASI_TUMI_SUTP_iNUA_No-9_April-2019.pdf.
CAT (Climate Action Tracker). 2020. “Paris Agreement Compatible Sectoral Benchmarks: Methods Report.” Berlin, Germany: CAT. https://climateactiontracker.org/documents/753/CAT_2020-07-10_ParisAgreementBenchmarks_FullReport.pdf.
Dalkmann, H., and C. Brannigan. 2014. “Transport and Climate Change. Module 5e: Sustainable Transport: A Sourcebook for Policy-Makers in Developing Cities.” Bonn, Germany: Deutsche Gesellschaft für Internationale Zusammenarbeit (GIZ) GmbH. https://doi.org/10.13140/2.1.4286.8009.
ICCT (International Council on Clean Transportation). 2020. “Vision 2050: A Strategy to Decarbonize the Global Transport Sector by Mid-Century.” ICCT. 2020. https://theicct.org/publications/vision2050.
IRENA (International Renewable Energy Agency). 2021. “World Energy Transitions Outlook - 1.5°C Pathway.” Abu Dhabi: IRENA. https://www.irena.org/publications/2021/Jun/World-Energy-Transitions-Outlook.
ITDP (Institute for Transportation and Development Policy). 2021. “Rapid Transit Database.” ITDP. https://www.itdp.org/rapid-transit-database/.
Montgomery County Planning. 2017. “Level of Traffic Stress Methodology.” Maryland: Montgomery Planning. https://montgomeryplanning.org/wp-content/uploads/2017/11/Appendix-D.pdf.
Moran, D., K. Kanemoto, M. Jiborn, R. Wood, J. Többen, and K.C. Seto. 2018. “Carbon Footprints of 13 000 Cities.” Environmental Research Letters 13 (6): 064041.
Moser, D. and A. Wagner. 2021. “Here Is Why Cities around the World Should Build 2 Km High Quality, Segregated Cycling Lane per 1000 Inhabitants.” Bonn: TUMI. https://www.transformative-mobility.org/assets/publications/TUMI_Strategy-Outlook_2km-bike-lanes-per-1000-inhabitants.pdf.
Mueller, N. D. Rojas-Rueda, M.Salmon, D.Martinez, A. Ambros, C. Brand, A. de Nazelle, et al. 2018. “Health Impact Assessment of Cycling Network Expansions in European Cities.” Preventive Medicine 109 (April): 62–70. doi:10.1016/j.ypmed.2017.12.011.
Searchinger, T., R. Waite, C. Hanson, and J. Ranganathan. 2019. “World Resources Report: Creating a Sustainable Food Future.” Washington, DC: World Resources Institute (WRI). https://research.wri.org/sites/default/files/2019-07/WRR_Food_Full_Report_0.pdf.
Teske, S., S. Niklas, and R. Langdon. 2021. “TUMI Transport Outlook 1.5°C - A Global Scenario to Decarbonize Transport.” Bonn: TUMI. https://outlook.transformative-mobility.org/.
United Nations. 2015. “The 17 Goals - Sustainable Development Goals.” United Nations. https://sdgs.un.org/goals.
United Nations. 2019. World Urbanization Prospects: The 2018 Revision.
United Nations General Assembly. 2020. Improving global road safety. Resolution adopted by the General Assembly on 31 August 2020. A/RES/74/299.
- Finance
See the technical note linked at the top of this web page for an explanation of the methodology underpinning the Systems Change Lab platform. This section explains how the methodology was applied in the finance system.
Selection of Shifts
For the finance system, we chose five shifts:
- Scale up public investment for climate and nature
- Scale up private investment for climate and nature
- Scale down investment harmful to climate and nature
- Extend economic and financial services to underserved and marginalized groups
- Ensure that the financial system accounts for climate- and nature-related risks
These shifts were chosen to track the investments and financial incentives needed to achieve the system transformations necessary to limit global temperatures to 1.5 degrees C (2.7 degrees F) while protecting biodiversity and improving equity. Finance is a key means of enabling climate action, with investment and aligned financial incentives playing a critical role in enabling change across all other systems. To reach net-zero greenhouse gas (GHG) emissions, halt biodiversity loss and ensure an equitable and just transition across all systems, sufficient finance from both public and private sources must be made available, and investments in emissions-intensive practices and technologies must be disincentivized through the removal of harmful subsidies and financing. The shifts reflect the different types of public and private financing and the various roles they can play, from corporate finance to international climate finance dedicated to adaptation.
Together, these shifts provide a comprehensive picture of progress for the Finance system as they look at the different stages and players necessary to align financial flows with climate, nature and equity goals.
Transforming the global financial system to support ambitious climate, nature and equity goals entails scaling up climate and nature investments, both public and private; ending harmful subsidies and investments; expanding financial inclusion; and accounting for climate- and nature-related risks.
The shifts start by looking at the two sources of investments and financing — the public and private sectors — by analyzing their unique drivers and their interdependent links that can scale up the investments needed to meet climate and nature targets. The next shift looks at the removal of market distortions and investments dedicated to environmentally harmful activities such as fossil fuel investments that support continued emissions and nature degradation. The final shifts cover public policies that can better shape markets, ranging from financial inclusion policies that provide greater access to financial services to underserved groups, and the accounting for climate- and nature-related risks that makes it possible to correctly assess and price those risks into the economic system.
Shifts 1, 2, 3, and 5 are primarily focused on limiting global temperature rise to 1.5 degrees C and protecting biodiversity, but they also incorporate equity considerations. These include the tracking of finance flows destined for low-income countries and the elimination of harmful financing which can reduce the inequities stemming from disproportionate impacts of climate change and nature degradation that will impact vulnerable and marginalized communities the most. Shift 4 is primarily focused on improving equity across underserved communities so that they can have greater access to financial services and resources, thereby helping them become more resilient to climate shocks and natural degradation that affect their livelihoods.
Selection of Targets and Indicators
In the finance system, we examine five shifts, each with respective indicators with 2030, 2035 or 2050 targets for insight into how finance can unlock greater action on climate, nature and equity. We used a variety of methodological approaches to design the outcomes for each indicator. Justification for the selected targets for outcome indicators can be found on the data platform by clicking an indicator’s tooltip icon. Some indicators do not have an associated target because there is no general agreement in the literature on what the target should be, but the indicator was deemed important based on a review of the literature and expert elicitation.
Some indicators are shown in more than one shift, especially in shifts 1 and 2, as the targets identified in the literature involve all sources (public and private), and a breakdown of the target is either not available or cannot be reliably calculated. In these instances, indicators show the total amount to match the target while providing a breakdown of the amount by source when data is available. It is important to note that methodologies and efforts to account for climate and nature finance flows are still in development. Due to fragmented reporting and limited data availability from both public and private sources, it remains difficult to make exact projections in these areas (Buchner et al. 2021).
Works Cited
Bhattacharya, Amar, Homi Kharas, and John McArthur. 2023. “Keys to Climate Action: Chapter 1 | Overview: How Developing Countries Could Drive Global Success and Local Prosperity.” Working Paper. Brookings Institution. https://www.brookings.edu/wp-content/uploads/2023/02/Chapter-1.-Keys-to-Climate-Action-Overview.pdf.
Bhattacharya, A., V. Songwe, E. Soubeyran, and N. Stern. 2024. “Raising Ambition and Accelerating Delivery of Climate Finance.” London: Grantham Research Institute on Climate Change and the Environment, London School of Economics and Political Science. https://www.lse.ac.uk/granthaminstitute/wp-content/uploads/2024/11/Raising-ambition-and-accelerating-delivery-of-climate-finance_Third-IHLEG-report.pdf.
Boehm, S., L. Jeffery, J. Hecke, C. Schumer, J. Jaeger, C. Fyson, K. Levin, A. Nilsson, S. Naimoli, E. Daly, J. Thwaites, K. Lebling, R. Waite, J. Collis, M. Sims, N. Singh, E. Grier, W. Lamb, S. Castellanos, A. Lee, M. Geffray, R. Santo, M. Balehegn, M. Petroni, and M. Masterson. 2023. State of Climate Action 2023. Berlin and Cologne, Germany, San Francisco, CA, and Washington, DC: Bezos Earth Fund, Climate Action Tracker, Climate Analytics, ClimateWorks Foundation, NewClimate Institute, the United Nations Climate Change High-Level Champions, and World Resources Institute. https://doi.org/10.46830/wrirpt.23.00010.
Buchner, Barbara, Baysa Naran, Pedro de Aragão Fernandes, Rajashree Padmanabhi, Paul Rosane, Matthew Solomon, Sean Stout, et al. 2021. “Global Landscape of Climate Finance 2021.” London: Climate Policy Initiative. https://www.climatepolicyinitiative.org/publication/global-landscape-of-climate-finance-2021/.
CBD. 2022. Kunming-Montreal Global Biodiversity Framework. https://www.cbd.int/doc/c/e6d3/cd1d/daf663719a03902a9b116c34/cop-15-l-25-en.pdf.
Climate Analytics and World Resources Institute. 2021. “Closing the Gap: The Impact of G20 Climate Commitments on Limiting Global Temperature Rise to 1.5°C.” Washington, D.C., and Berlin, Germany: Climate Analytics and World Resources Institute. https://www.wri.org/research/closing-the-gap-g20-climate-commitments-limiting-global-temperature-rise.
COP 26 Presidency. 2021. “Statement on International Public Support for the Clean Energy Transition.” 2021. https://ukcop26.org/statement-on-international-public-support-for-the-clean-energy-transition/.
Demirgüç-Kunt, A., L. Klapper, D. Singer, and S. Ansar. 2022. The Global Findex Database 2021: Financial Inclusion, Digital Payments, and Resilience in the Age of COVID-19. The World Bank. doi:10.1596/978-1-4648-1897-4.
Forbes. 2022. “The Global 2000.” https://www.forbes.com/lists/global2000/?sh=6b81aed65ac0.
G7. 2016. “G7 Ise-Shima Leaders’ Declaration.”G7 Ise-Shima Summit, May 26-27 2016. Ise-Shima. https://www.mofa.go.jp/files/000160266.pdf.
G20. 2009. “Leaders’ Statement: The Pittsburgh Summit.” G20 Pittsburgh Summit, September 24-25, 2009. Pittsburgh. https://www.oecd.org/g20/summits/pittsburgh/G20-Pittsburgh-Leaders-Declaration.pdf.
GFANZ (Glasgow Financial Alliance for Net Zero). 2021. “The Glasgow Financial Alliance for Net Zero: Our Progress and Plan towards a Net-Zero Global Economy.” Glasgow: The Glasgow Financial Alliance for Net Zero. https://www.gfanzero.com/progress-report/.
Global Canopy Programme. 2022. “Forest 500 - 2022 Annual Report.” https://forest500.org/sites/default/files/forest500_2022report_final.pdf.
IEA. 2021. “Net Zero by 2050: A Roadmap for the Global Energy Sector.” Paris: International Energy Agency. https://www.iea.org/reports/net-zero-by-2050.
IEA. 2023. “World Energy Investment 2023.” IEA. https://www.iea.org/reports/world-energy-investment-2023/overview-and-key-findings.
IPCC. 2022. “IPCC Sixth Assessment Report: Mitigation of Climate Change.” Geneva: IPCC. https://www.ipcc.ch/report/ar6/wg3/.
Net Zero Asset Managers Initiative. 2021. “Net Zero Asset Managers Initiative - Progress Report.” https://www.netzeroassetmanagers.org/media/2021/12/NZAM-Progress-Report.pdf.
Sovereign Wealth Fund Institute. n.d. “Top 100 Largest Insurance Rankings by Total Assets.” https://www.swfinstitute.org/fund-rankings/insurance.
S&P Global Market Intelligence. 2021. “The World’s Top 100 Largest Banks 2020.” https://pages.marketintelligence.spglobal.com/SM-Global-Bank-Ranking-Content-request-Global.html.
TCFD (Task Force on Climate-related Financial Disclosures). 2017. “Recommendations of the Task Force on Climate-Related Financial Disclosures.” TCFD. https://www.fsb-tcfd.org/wp-content/ uploads/2017/06/FINAL-TCFD-Report-062817.pdf.
Thinking Ahead Institute. 2021. “The Asset Owner 100 – 2021.” https://www.thinkingaheadinstitute.org/research-papers/the-asset-owner-100-2021/.
Thinking Ahead Institute and Pensions & Investments. 2021. “The World’s Largest Asset Managers – 2021.” https://www.thinkingaheadinstitute.org/research-papers/the-worlds-largest-asset-managers-2021/.
TNFD (Taskforce on Nature-related Financial Disclosures). 2022. “TNFD Nature-Related Risk & Opportunity Management and Disclosure Framework.” https://framework.tnfd.global/.
UNCDF. n.d. “Financial Inclusion and the SDGs - UN Capital Development Fund (UNCDF).” https://www.uncdf.org/financial-inclusion-and-the-sdgs.
UNEP. 2021a. Adaptation Gap Report 2020. https://www.un-ilibrary.org/content/books/9789280738346.
UNEP. 2021b. “State of Finance for Nature.” Nairobi, Kenya: United Nations Environment Programme. https://www.unep.org/resources/state-finance-nature.
UNFCCC (UN Framework Convention on Climate Change). 2009. Copenhagen Accord. https://unfccc.int/process-and-meetings/conferences/past-conferences/copenhagen-climate-change-conference-december-2009/cop-15/cop-15-decisions.
UNFCCC. 2015. Adoption of the Paris Agreement. https://unfccc.int/resource/docs/2015/cop21/eng/10a01.pdf.
UNFCCC. 2021. Glasgow Climate Pact. https://unfccc.int/process-and-meetings/the-paris-agreement/the-glasgow-climate-pact-key-outcomes-from-cop26.
- Industry
See the technical note linked at the top of this web page for an explanation of the methodology underpinning the Systems Change Lab platform. This section explains how the methodology was applied in the industry system.
Selection of Shifts
Moving toward net-zero GHG emissions from industry will be key to limiting global warming to no more than 1.5°C (IPCC 2022). For the industry system, we chose five shifts which, collectively, will help decarbonize the industry sector:
- Reduce demand for cement, steel and plastics
- Improve industrial energy efficiency
- Electrify industry
- Commercialize new solutions for cement, steel and plastics
- Reduce methane emissions from oil and gas operations as they are phased down
All five shifts are primarily focused on helping limit global temperature rise to 1.5°C. They were chosen to cover both the demand and supply sides of industrial manufacturing and the various emission sources of industrial activities. These shifts represent key mitigation areas, including circularity and the reduction of demand for industrial products, as well as already available technologies to improve energy efficiency. They also reflect the need to develop and deploy new technologies, solutions, infrastructure, and supply chains. Together, monitoring progress toward these shifts provides a comprehensive picture of progress for the industry system because they cover the key mitigation areas required to decarbonize industrial activities.
Significantly increasing energy efficiency, which reduces energy use while maintaining services, can not only help reduce this system’s GHG emissions, but also lower the total amount of energy consumed across industry that would otherwise need to be decarbonized. This must be achieved through technical energy efficiency and retrofits, material efficiency, and service efficiency (ETC 2020). These are covered in shifts 1 and 2.
Electrification with a clean grid or with dedicated distributed/on-site low-carbon electricity supply offers another strategy for curbing releases of GHGs, particularly for low- and medium-temperature heat processes that currently rely on fossil fuels. This is covered in shift 3. However, not all industrial processes can be easily electrified. Thus, decarbonizing these processes requires strategies such as switching to new zero-carbon fuels to deliver high-temperature heat, developing and switching to technologies that eliminate process emissions and/or reliance on high heat, and using conventional technologies with carbon capture, utilization, or storage (CCUS), all of which are covered in shift 4.
The literature shows that production of oil and gas must be significantly scaled down by 2050 to achieve a 1.5°C scenario, and new investments in production would be detrimental (IEA 2021b). As long as oil and gas are still produced and abandoned wells have not been capped, it is important to reduce fugitive methane emissions, which cannot be mitigated through carbon capture and sequestration. This is addressed in shift 5. Methane, a major component of fossil gas, causes the atmosphere to absorb 83 times more heat over 20 years than carbon dioxide (CO2) and about 30 times more over a century, so reducing methane emissions can deliver large GHG benefits in the short term (IPCC 2021). Controlling methane emissions from oil and gas operations requires upgrades to equipment and better data to detect and repair leaks from equipment across the supply chain.
Selection of Targets and Indicators
To track progress made toward accelerating these system-wide shifts, we identified key indicators from the reports and data platforms of major agencies, including the IPCC and the International Energy Agency (IEA).
The industry indicators were selected with the aim of gauging overall progress across the system, as well as progress made in achieving the aforementioned required shifts. We track progress made toward the first shift by tracking the demand for key industrial materials. The shifts 2 and 4 are tracked through a closer look at the production of cement, steel and plastics1 — which, when taken together, account for about 70 percent of CO2 emissions from the industry system (IEA 2021b). We track shift 3 by monitoring the share of electricity in industry’s final energy demand.
Reductions in carbon intensity of cement, steel, and plastics production reflect improvements in energy efficiency, alongside progress made in implementing mitigation measures that go beyond efficiency (for example, electrification of high-temperature heat processes or adoption of new fuels and feedstocks). We placed these carbon-intensity indicators in shift 4, but they are relevant for other shifts as well. We also track green hydrogen production and installed electrolyzer capacity as part of shift 4, as hydrogen is one of the most promising non-carbon chemical feedstocks (for instance, for steel, ammonia, and methanol production) and could also be used as an energy carrier for high-temperature heat generation.
For shift 5, we track overall methane emissions from oil and gas operations and the volume of fossil gas flared (intentionally burned off for economic or safety reasons).
CAT 2020 used both top-down and bottom-up methods to establish targets for the share of electricity in the industry sector’s final energy demand, the carbon intensity of global cement production, and the carbon intensity of global steel production.
For the share of electricity in the industry sector’s final energy demand, we adopted targets from CAT 2023, which employed a top-down approach to establishing near- and long-term targets for this indicator. CAT 2023 identified modelled pathways that limit global temperature rise to 1.5°C with no or limited overshoot from IPCC 2022, then filtered them using a set of defined criteria. The 50th percentile from this set of filtered scenarios formed the less ambitious bound of the target range, while the 95th percentile served as the more ambitious bound.
For the carbon intensities of global cement production and global steel production, we retained targets derived from CAT 2020, which employed bottom-up methods to establish near- and long-term targets, as well as top-down methods to validate these goals. Because integrated assessment models provide less granularity and are thus limited in terms of their potential for defining sectoral targets, CAT relied on bottom-up, sectoral modelling tools, which allowed the authors to apply a wider range of mitigation options that would enable full decarbonization of the sector as quickly as possible. Academic and gray literature assessing the technical and feasible potential of these mitigation options within the industry sector informed this bottom-up, sectoral modelling. CAT then compared the targets derived from this bottom-up, sectoral modelling with those from the filtered set of IPCC (2018) scenarios to ensure that if there was any discrepancy, the targets taken from the bottom-up, sectoral modelling would be more ambitious in achieving decarbonization more rapidly. For the carbon intensity of global cement production indicator, specifically, CAT 2020 considered both direct emissions and emissions generated by power used during production (indirect emissions).
The green hydrogen production target was sourced from IEA (2022a) and installed electrolyzer capacity targets was sourced from (IEA 2021b), which model the projected demand for green hydrogen across sectors and electrolyzer capacity by 2030 and 2050 in order to reach net-zero emissions by 2050.
Targets for oil and gas methane indicators in shift 5 were identified from the IEA’s Global Methane Tracker and Net Zero by 2050 scenario.
Equity-related targets have not yet been established for the industry system but may be included in a future iteration. We are still exploring how best to measure equity in this system. Biodiversity-related indicators are not established under this system, and these are addressed in other systems such as circular economy and biomes-related systems.
Not every indicator in the industry system has an associated target. This is either because no targets have been developed for that indicator or because there is no general agreement in the literature on what the target should be, but the indicator was deemed important based on a review of the literature and expert elicitation.
i Although plastics are not currently covered in the list of indicators, they will be added in the near-term future.
Works Cited
CAT (Climate Action Tracker). 2020. “Paris Agreement Compatible Sectoral Benchmarks: Methods Report.” Berlin: CAT. https://climateactiontracker.org/documents/753/CAT_2020-07-10_ParisAgreementBenchmarks_FullReport.pdf.
CAT. 2023. Methodology for 1.5°C Compatible Sectoral Benchmarks. Berlin: CAT. https://climateactiontracker.org/publications/paris-aligned-benchmarks-power-sector/.
ETC (Energy Transitions Commission). 2020. “Making Mission Possible: Delivering a Net-Zero Economy.” https://www.energy-transitions.org/wp-content/uploads/2020/09/Making-Mission-Possible-Executive-Summary-English.pdf.
IEA (International Energy Agency). 2021a. “Flaring Emissions.” IEA. 2021. https://www.iea.org/reports/flaring-emissions.
IEA. 2021b. “Net Zero by 2050: A Roadmap for the Global Energy Sector.” Paris: IEA. https://www.iea.org/reports/net-zero-by-2050.
IEA. 2022a. World Energy Outlook 2022. https://www.iea.org/reports/world-energy-outlook-2022.
IEA. 2022b. “Global Methane Tracker 2022.” IEA. 2022.
IPCC (Intergovernmental Panel on Climate Change). 2018. Global Warming of 1.5°C. An IPCC Special Report on the Impacts of Global Warming of 1.5°C above Pre-industrial Levels and Related Global Greenhouse Gas Emission Pathways, in the Context of Strengthening the Global Response to the Threat of Climate Change, Sustainable Development, and Efforts to Eradicate Poverty. Edited by V. Masson-Delmotte, P. Zhai, H.-O. Pörtner, D. Roberts, J. Skea, P.R. Shukla, A. Pirani, et al. Geneva: IPCC. https://www.ipcc.ch/site/assets/uploads/sites/2/2019/06/ SR15_Full_Report_High_Res.pdf.
IPCC. 2021. Climate Change 2021: The Physical Science Basis. Contribution of Working Group I to the Sixth Assessment Report of the Intergovernmental Panel on Climate Change. Edited by Valérie. Masson-Delmotte, Panmao Zhai, Anna Pirani, Sarah L. Connors, Clotilde Péan, Sophie Berger, Nada Caud, et al. Cambridge, UK and New York, NY, USA: Cambridge University Press. https://www.ipcc.ch/report/ar6/wg1/.
IPCC. 2022. IPCC. 2022. Climate Change 2022: Mitigation of Climate Change. Contribution of Working Group III to the Sixth Assessment Report of the Intergovernmental Panel on Climate Change. Edited by P.R. Shukla, J. Skea, R. Slade, A. Al Khourdajie, R. van Diemen, D. McCollum, M. Pathak, et al. Cambridge, UK, and New York: Cambridge University Press. https://www.ipcc.ch/report/ar6/wg3/.
MPP (Mission Possible Partnership). 2022. Making Net-Zero Steel Possible: An Industry-backed, 1.5°C-aligned Transition Strategy. https://missionpossiblepartnership.org/wp-content/uploads/2022/09/Making-Net-Zero-Steel-possible.pdf.
- Technological Carbon Removal
See the technical note linked at the top of this web page for an explanation of the methodology underpinning the Systems Change Lab platform. This section explains how the methodology was applied in the carbon removal system.
Selection of the Shift
Significantly reducing greenhouse gas (GHG) emissions is essential to reaching net-zero CO2 emissions by around mid-century, and net-zero GHG emissions thereafter, and should remain the top global priority. However, emissions reductions alone will not be enough to meet the goal of limiting global warming to 1.5°C. All modelled pathways that limit warming to 1.5°C rely on CO2 removal (referred to hereafter as carbon removal) as a complement to deep emissions reductions (IPCC 2022). Carbon removal includes a range of nature-based approaches as well as technologies that can pull CO2 directly from the atmosphere (NASEM 2019).
Carbon removal is needed to remove excess CO2 in the atmosphere to stay within the limited carbon budget available for keeping temperature rise to 1.5°C. In the near term, before and at net-zero, it can counterbalance residual GHG emissions for which abatement technologies do not become available or are not cost-effective at scale. This includes, for example, long-haul aviation, some heavy industry, and non-CO2 emissions from agriculture (Honegger et al. 2021; IPCC 2022). In the longer term, carbon removal will be needed to address legacy emissions, or all of the cumulative historical emissions causing climate impacts today, by achieving net-negative emissions. This level of removal can be achieved by scaling up a range of carbon removal approaches and technologies, including strategies generally considered natural or land-based (for example, reforestation, agricultural soil management, and coastal wetland restoration) and those considered more technological (such as direct air capture and enhanced carbon mineralization).
Developing a diverse portfolio of carbon removal approaches will be critical to reducing costs, minimizing risks, and balancing the tradeoffs associated with any one approach (Rueda et al. 2021; Mulligan et al. 2020). A portfolio that includes only nature-based approaches could face uncertainty around permanence and land area constraints, while a technology-specific portfolio would be more costly and lack many of the co-benefits that natural approaches can provide for resilience and biodiversity. For example, a technology-based approach like direct air capture (DAC) is energy-intensive but uses comparatively little land and, when coupled with geologic sequestration, results in permanent storage. On the other hand, tree planting provides many co-benefits but requires comparatively more land (which could be used for other purposes) and can be reversible (for example, through wildfires). Some ocean-based approaches have large theoretical potential but present many ecological and governance uncertainties today.
In the carbon removal system, we include only one shift: scale up technological carbon removal. Shifts related to approaches generally considered to be natural carbon removal can be found in the land system.
Within this shift, we chose one key indicator to track progress on carbon removal: how many tonnes of CO2 have been captured from the air through technological carbon removal approaches and stored permanently. To meet this definition of technological carbon removal, CO2 must be captured from the atmosphere, rather than at a point source like a cement plant (this would be considered emissions reduction rather than carbon removal, since it is preventing emissions from entering the atmosphere). Then it must be permanently sequestered through injection into deep, underground geological formations through the creation of stable carbonate minerals, or used in durable products. When tracking progress for this indicator, net tonnes, rather than gross tonnes, of removal should be considered in order to most directly track the magnitude of carbon removal’s impact on the atmosphere.
This indicator is focused primarily on our goal of limiting global temperature rise to 1.5°C, but the Systems Change Lab’s other goals of protecting biodiversity and improving equity are key considerations when assessing progress in carbon removal.
A range of key enablers and barriers are also tracked. Some of these — such as deployment support or purchasing of carbon dioxide removal (CDR) credits — directly enable scale-up of CDR, while others track the quality of CDR projects, provide leading indicators of innovation, or track public discourse. Scaling up technological carbon removal will require increased public funding for research, development, demonstration, and deployment of new technologies and approaches, along with private sector leadership in terms of both purchasing and providing high quality removals. Enabling infrastructure like CO2 pipelines, geologic sequestration, and abundant, clean and renewable energy will also be needed (see power system). At the same time, as technological carbon removal is a relatively new industry, there is an opportunity and imperative to scale responsibly. Deep emissions reductions are needed to reduce new emissions into the atmosphere and carbon removal is a necessary complement, and the only way we have to ultimately reach net-negative emissions to reduce atmospheric concentrations of CO2, which will help reduce the worst impacts of climate change that are disproportionately affecting vulnerable communities today.
Along with scaling up the technology, governance frameworks need to be strengthened at local, national, and international levels to ensure projects are developed responsibly. This includes attention to development of consistent and credible measurement, reporting, and verification standards, development of fit-for-purpose regulation and permitting processes, prioritization of community engagement throughout project development, and focus not only on carbon benefits but also environmental and social impacts of scaling up different approaches. This effort can help build public understanding of and trust in this new industry.
Selection of Targets
The 2030 and 2050 targets for this indicator are based on the range of modelled pathways that limit global temperature rise to 1.5°C with no or limited overshoot, as presented in IPCC (2022). Following CAT (2023), we filtered these pathways to identify a subset that meets sustainability criteria based on Fuss et al. (2018) for biomass cultivation for carbon removal outlined in IPCC (2018). We used a 90th percentile range (from the 5th to the 95th percentiles) for the 2030 and 2050 levels of technological carbon removal (that is, from bioenergy with carbon capture and storage, direct air capture, and mineralization, which are the technologies incorporated into integrated assessment models) as 2030 and 2050 targets. See Boehm et al. 2023 and Jaeger et al. 2023 for more information.
Our targets include a range for both 2030 and 2050 to reflect the uncertainty associated with future need for technological carbon removal, as well as its dependence on the level of mitigation across sectors. The lower end of the range reflects scenarios in which GHG emissions reductions are greater in the near term, and future carbon removal reliance is minimized.
Works Cited
Boehm, S., L. Jeffery, J. Hecke, C. Schumer, J. Jaeger, C. Fyson, K. Levin, A. Nilsson, S. Naimoli, E. Daly, J. Thwaites, K. Lebling, R. Waite, J. Collis, M. Sims, N. Singh, E. Grier, W. Lamb, S. Castellanos, A. Lee, M. Geffray, R. Santo, M. Balehegn, M. Petroni, and M. Masterson. 2023. State of Climate Action 2023. Berlin and Cologne, Germany, San Francisco, CA, and Washington, DC: Bezos Earth Fund, Climate Action Tracker, Climate Analytics, ClimateWorks Foundation, NewClimate Institute, the United Nations Climate Change High-Level Champions, and World Resources Institute. https://doi.org/10.46830/wrirpt.23.00010.
CAT (Climate Action Tracker). 2020. “Paris Agreement Compatible Sectoral Benchmarks: Methods Report.” Berlin: CAT. https://climateactiontracker.org/documents/753/CAT_2020-07-10_ParisAgreementBenchmarks_FullReport.pdf.
Fuss, S., W.F. Lamb, M.W. Callaghan, J. Hilaire, F. Creutzig, T. Amann, T. Beringer, et al. 2018. “Negative Emissions—Part 2: Costs, Potentials and Side Effects.” Environmental Research Letters 13 (6). IOP Publishing:063002. doi:10.1088/1748-9326/aabf9f.
Honegger, M., M. Poralla, A. Michaelowa, and H.M. Ahonen. 2021. “Who Is Paying for Carbon Dioxide Removal? Designing Policy Instruments for Mobilizing Negative Emissions Technologies.” Frontiers in Climate 3. https://www.frontiersin.org/article/10.3389/fclim.2021.672996.
IPCC. 2018. Special Report: Global Warming of 1.5C. Intergovernmental Panel on Climate Change. https://www.ipcc.ch/sr15/chapter/chapter-2/.
IPCC. 2022. Climate Change 2022: Mitigation of Climate Change. Contribution of Working Group III to the Sixth Assessment Report of the Intergovernmental Panel on Climate Change. Edited by P.R. Shukla, J. Skea, R. Slade, A. Al Khourdajie, R. van Diemen, D. McCollum, M. Pathak, et al. Cambridge and New York: Cambridge University Press. https://www.ipcc.ch/report/ar6/wg3/.
Jaeger et al. 2023. Methods for State of Climate Action. https://systemschangelab.org/sites/default/files/2023-11/23_TN_A4_State%20of%20Climate%20Action%202023_v5.pdf.
Mulligan, J., A. Rudee, K. Lebling, K. Levin, J. Anderson, and B. Christensen. 2020. “CarbonShot: Federal Policy Options for Carbon Removal in the United States.” Washington, DC: WRI. https://www.wri.org/publication/carbonshot-federal-policy-options-for-carbon-removal-in-the-united-states.
NASEM (National Academies of Science, Engineering, and Medicine). 2019. “Negative Emissions Technologies and Reliable Sequestration: A Research Agenda.” Washington, DC: NASEM. https://doi.org/10.17226/25259.
Rueda, O., J.M. Mogollón, A. Tukker, and L. Scherer. 2021. “Negative-Emissions Technology Portfolios to Meet the 1.5 °C Target.” Global Environmental Change 67 (1 March 1): 102238. https://doi.org/10.1016/j.gloenvcha.2021.102238.
- Circular Economy
See the technical note linked at the top of this web page for an explanation of the methodology underpinning the Systems Change Lab platform. This section explains how the methodology was applied in the circular economy system.
Selection of Shifts
Circular economy is a model of production and consumption, replacing the traditional linear economy model that is based on “take-make-waste" patterns. It not only closes the resource loops, but also narrows and slows the loops, and thereby makes resource use more sustainable, reduces the environmental impact, and creates more economic value from a certain amount of resource.
In the circular economy system, we chose six shifts:
- Decrease overconsumption
- Use recycled, reused, and renewable materials and components
- Minimize environmental and social harms in resource extraction
- Make production more resource efficient
- Use products longer
- Increase the quantity and value of resources recovered at end of use
These shifts were chosen to holistically cover all life stages of materials — from resource extraction and material selection, through production and use, to recycling — as shown in Figure 1. It is important to note that these shifts are interrelated to each other and should not be considered independently. Otherwise, the loop cannot be closed and material circulation cannot be achieved effectively. For example, the use of recycled materials and recycling at the end-of-life stage should be matched to close the loop of a circular economy. Resource efficient production can reduce the amount of resources used, but it can also have a side effect of lowering production cost and product prices, which could, in turn, increase final consumption. Strong motivation to narrow the loop by reconsidering the overall level of consumption is necessary.
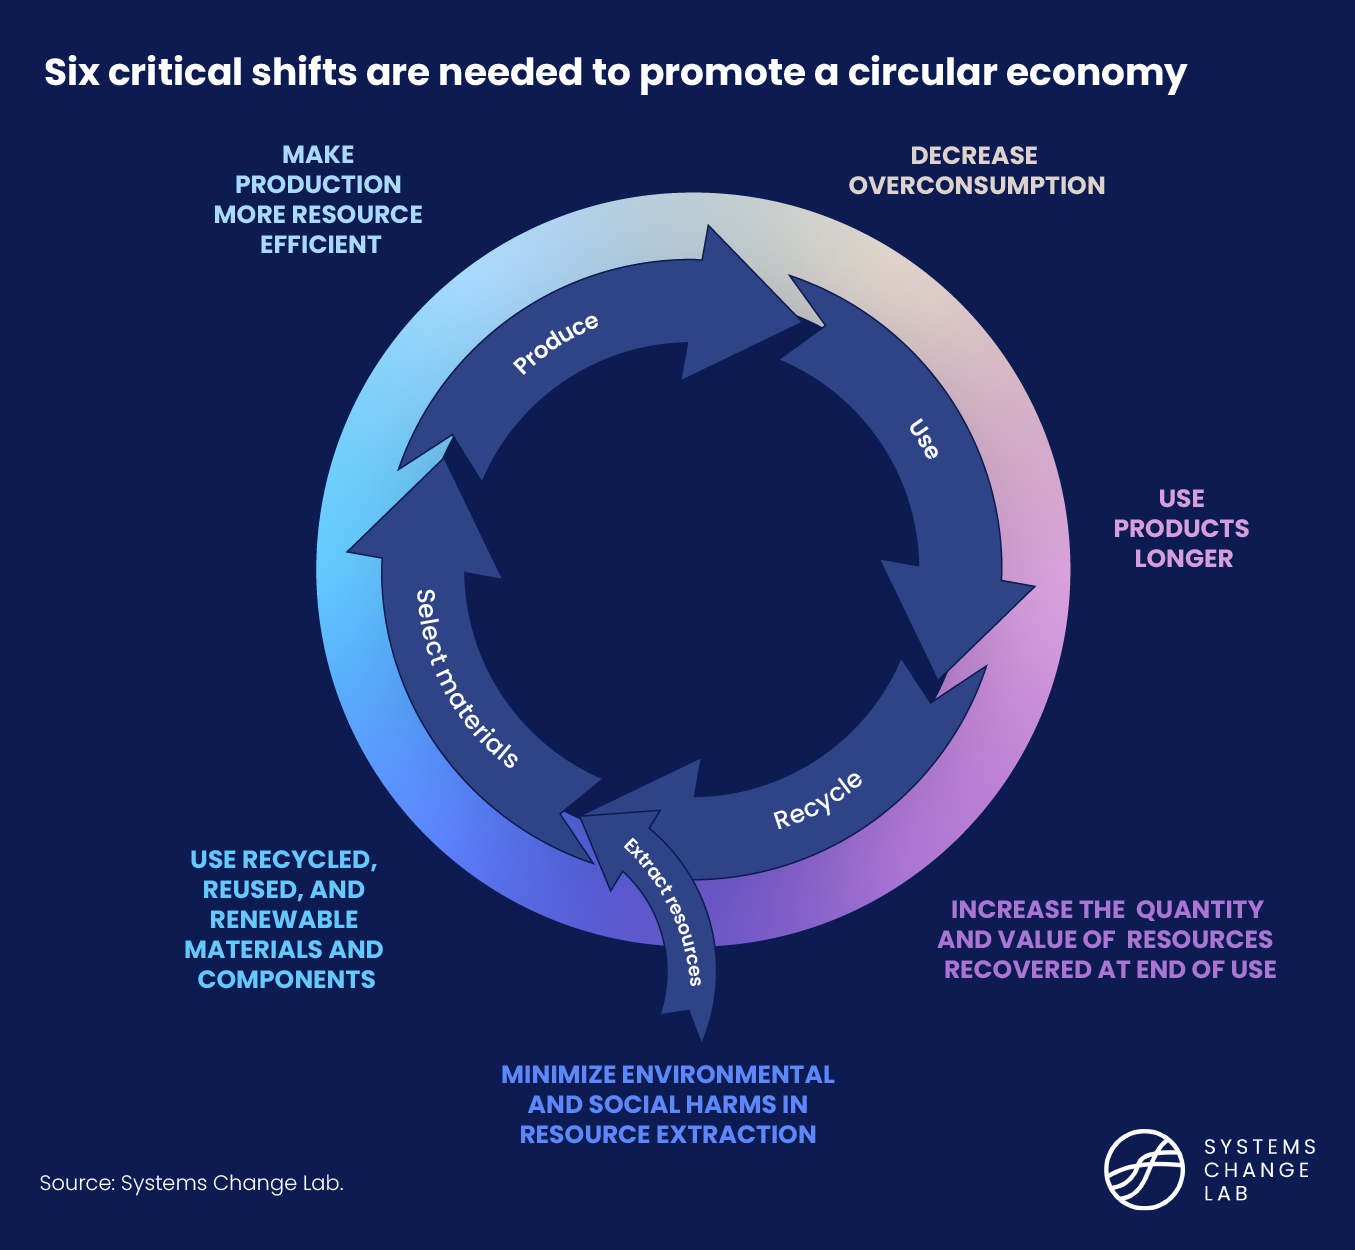
Figure 1. A circular economy is built off of the life stages of materials (inner circle) and six shifts for realizing a circular economy (outer circle). Materials’ life is formed in a circular manner in a circular economy, and the six shifts are linked to each other like a chain. Each shift is related mainly to one or two life stages.
Circular economy is often explained as a combination of reduce, reuse, and recycle activities; however, practitioners frequently neglect the importance of the “reduce” concept (Kirchherr et al. 2017). Recycling on a large scale is not a solution to replacing the “take-make-waste" linear economy, and priority should be given to “reduce,” as the concept of waste management hierarchy explains. Therefore, one of the shifts addresses overconsumption of resources in both production and use. The shift intends to ensure human activities fit within the global capacity of the environment to achieve a sustainable level of consumption, with attention to equitable access to resources that are necessary for everyone in both developing and developed countries. It is important to find alternative consumption patterns such as sharing and other dematerialization by using business model transformation to avoid overuse and overexploitation of valuable resources.
Three shifts — “Use recycled, reused, and renewable materials and components,” “Minimize environmental and social harms in resource extraction,” and “Make production more resource efficient” — address the selection and efficiency of use of materials and resources in production. For products that are manufactured goods, the utilization of reused components or parts, recycled materials and renewable materials will effectively reduce the burden on sourcing virgin, non-renewable materials. For products from the biosphere, resources that are truly renewable should be used. Production that is more resource efficient by using improved methods and technologies or sharing valuable resources, such as byproducts, also helps effectively reduce overall resource inputs. In some cases, these actions require business model transformation.
Another shift, “Use products longer,” addresses retaining the value of a resource for as long as possible (for instance, retaining the functionality of a product by repairing it). This defers the need to replace the product, reduces the need for additional materials to produce replacement products, and therefore narrows the resource inputs. This is sometimes referred to as slowing the resource loop.
The last shift, “Increase the quantity and value of resources recovered at end of use,” addresses the end-of-use stage. Recoverable materials and components for reuse and recycling, including remanufacturing, are separated from waste streams for reuse or further processing so that maximum net value is gained. Net value here refers to the amount of functional and monetary opportunity in the recirculation of the resource. For example, recovering parts that are used in remanufacturing a product typically has a higher net value than producing recycled materials.
Implementing a circular economy can help toward the goals of limiting climate change to 1.5 degrees C (2.7 degrees F) and protecting biodiversity. If the shifts of reduction, material substitution, and efficient production are applied to fossil fuels, it enables a reduction in the use of fossil fuels (see, for instance, IRP 2020; Ellen MacArthur Foundation 2021). The shift toward minimizing environmental harms is directly related to the goal of protecting biodiversity. Other shifts promote the reduction of natural resource use and thereby reduce associated burdens on the ecosystem indirectly. The shifts toward longer use and resource recovery can contribute to limiting climate change to 1.5 degrees C but can also be contradictory in some cases. For example, if old energy-inefficient products are used longer, they consume more energy (see Tasaki et al. 2013; Bakker and Schuit 2017). Recycling and recovery require a certain amount of energy. If too much energy is needed, for example, due to impurities in the collected waste resulting from poor sorting or an inefficient process of collection and recycling, the justification for recycling and recovery may be reduced. In addition, excessive ownership of products can cause energy use at the use phase as well as production phase. Proper attention by all stakeholders in material circulation is needed to understand the trade-offs.
Selection of Targets and Indicators
No global target for material footprint or circularity has been agreed upon, although the global community has agreed that efficient use of natural resources and decoupling economic growth from environmental degradation are necessary. Therefore, we relied on scientific literature. In a scientific article, Bringezu (2019) suggested targets of global resource use. We employed the targets as global targets of three material footprint indicators in the shift of overconsumption. These targets can be used as national and subnational targets, as they are per capita targets.
Indicators that are highly relevant to the achievement of the shifts and accurate were selected. Data accessibility, completeness, timeliness, and ease of collection were also taken into account, but these are considered secondary because systems change often requires changes in perception and monitoring new aspects.
The indicators used on this platform cover all the elements of “narrowing, slowing, and closing resource flows (loops)," as well as the so-called 3Rs, “reduce, reuse, and recycle.” We understand that there are diverse understandings and perceptions about the concept of circular economy (CE) in the world. For example, in our understanding, practitioners in industries tend to pay more attention to the circulation of materials in the economy, while environmentalists pay attention to environmental impacts resulting from activities toward CE. Traditional waste management experts tend to look at the end-of-use stage and 3R activities, and some producers tend to look at the production stage and innovation of business models. These differences are, to some extent, reflected in national policies. For example, Ernst & Young’s assessment of national CE policy (2022) ranks countries into four levels, ranging from basic waste management and recycling to mature national CE policy. Therefore, we were cautious not to rely on a single view and to select indicators in a balanced way: environmental and social impacts are covered by shift 3 indicators, industries and production views are covered mainly by indicators in shifts 2 and 4, consumption views are covered mainly by indicators in shifts 1 and 5, and end-of-use 3R views are covered by shift 6.
For the selection of indicators, we relied more on public reports, which are typically based more on multiple stakeholders’ opinions. We especially referred to UNEP International Resource Panel (IRP) reports (2019a; 2019b) and public policy such as the European Union’s CE policy package and member countries’ national plans for CE. We also paid attention to CE indicators proposed by the Organisation for Economic Co-operation and Development (OECD) (2020), Platform for Accelerating the Circular Economy (PACE) (2021), Ellen MacArthur Foundation (2022), World Business Council for Sustainable Development (WBCSD) (2022), the emerging ISO 59020 “Circular economy — Measuring and assessing circularity,” and action agendas put forward by PACE.
The indicators attempt to monitor actions made by various stakeholders in the value chain of material use. Attention was paid to both the public and private sectors. The indicators also measure outcomes and efforts in terms of both overall situations and specific situations of materials, products, and waste with high policy attention. Therefore, food waste and municipal waste are included because Sustainable Development Goal targets address these wastes. Single-use products, packaging, plastics, electronics, automobiles, etc., are included because many countries have paid much policy attention to these issues.
Works Cited
Bakker, C.A., and C.S.C. Schuit. 2017. The Long View: Exploring Product Lifetime Extension. United Nations Environment Programme (UNEP).
Bringezu, S. 2019. “Toward Science-Based and Knowledge-Based Targets for Global Sustainable Resource Use.” Resources 8 (3): 140. doi:10.3390/resources8030140.
Ellen MacArthur Foundation. 2021. Completing the picture: How the circular economy tackles climate change.
Ellen MacArthur Foundation. 2022. Circulytics: indicators.
Ernst & Young. 2022. Regulatory landscape of the circular economy.
EU (European Union). 2020. “Regulation 2020/852 on the Establishment of a Framework to Facilitate Sustainable Investment.” http://data.europa.eu/eli/reg/2020/852/oj.
IRP (International Resource Panel). 2019a. Global Resources Outlook 2019: Natural Resources for the Future We Want.
IRP. 2019b. Mineral resource governance in the 21st Century.
IRP. 2020. Resource Efficiency and Climate Change: Material Efficiency Strategies for a Low-Carbon Future.
ISO (International Organization for Standardization). 2023. DIS 59020 “Circular economy — Measuring and assessing circularity.”
Kirchherr, J., D. Reike, and M. Hekkert. 2017. “Conceptualizing the Circular Economy: An Analysis of 114 Definitions.” Resources, Conservation and Recycling 127 (December): 221–32. doi:10.1016/j.resconrec.2017.09.005.
OECD (Organisation for Economic Co-operation and Development). 2020. The OECD Inventory of Circular Economy Indicators. https://www.oecd.org/cfe/cities/InventoryCircularEconomyIndicators.pdf.
PACE (Platform for Accelerating the Circular Economy). 2021. Circular Indicators for Governments: Accelerating action in the circular economy.
PACE. Undated. The Circular Economy Action Agenda. https://pacecircular.org/action-agenda. Accessed 24 May 2022.
Tasaki, T., M. Motoshita, H. Uchida, and Y. Suzuki. 2013. “Assessing the Replacement of Electrical Home Appliances for the Environment: An Aid to Consumer Decision Making.” Journal of Industrial Ecology 17 (2): 290–98. doi:10.1111/j.1530-9290.2012.00551.x.
WBCSD (World Business Council for Sustainable Development). 2022. Circular Transition Indicators V3.0 - Metrics for business, by business.
- Cities
See the technical note linked at the top of this web page for an explanation of the methodology underpinning the Systems Change Lab platform. This section explains how the methodology was applied in the cities system.
Selection of Shifts
In the cities system, we chose three shifts:
- Plan urban land use to reduce emissions and increase climate resilience
- Increase access to resilient and affordable urban services
- Improve urban waste management and transition to zero-waste cities
The world’s urban population is expected to increase by 2.5 billion people by 2050, by which point roughly two-thirds of the global population is expected to live in urban areas. Much of this urban growth will likely occur in low-lying coastal zones and locations vulnerable to severe flooding and extreme heat risks. For this reason, cities play an essential role in limiting climate change to 1.5 degrees C (2.7 degrees F), protecting biodiversity and improving equity.
Cities provide a broad set of services, including housing, transportation, education, health and employment. Because of this, there are many connections between the cities system and other systems on this platform, including systems related to transport, power, buildings and finance. The shifts in this system were chosen for their importance to decarbonization, biodiversity and equity goals in urban areas, and to complement the indicators in other systems.
Planning urban land use to reduce emissions and increase climate resilience helps reduce entrenched inequities, reduce greenhouse gas emissions, build systemic resilience to impacts and improve air quality. Increasing access to resilient and affordable urban services helps reduce inequities within cities, improve public health and reduce environmental damage. Rapidly scaling up zero-waste outcomes in cities cuts a source of methane emissions, improves inequitable health disparities, and encourages more circularity in consumption patterns, which can help drive down emissions in industry.
Selection of Targets and Indicators
For shift 1, the indicators focused on the opportunities inherent in land use strategies that promote efficient utilization of urban land with higher densities, better connectivity to infrastructure and services and preservation of green and blue spaces. Together, these strategies can help achieve lower greenhouse gas (GHG) emissions, ensure more equitable access to opportunities and improve resilience to climate risks. Shift 1 is primarily focused on reducing emissions and protecting biodiversity, in addition to a few equity-related indicators (including the level of air pollution in urban areas and share of urban areas that are in slums or informal settlements). The selection of targets and indicators in shift 1 is described in the “information” modal button on each indicator chart.
For shift 2, the indicators were selected to show how delivering basic urban services to growing populations can serve both climate mitigation and adaptation goals when done in ways that limit GHG emissions and foster climate resilience. The targets for many of the indicators in shift 2 are in line with targets in the Sustainable Development Goals (especially Goals 7 and 11). Shift 2 is primarily focused on improving equity. The selection of targets and indicators in shift 2 is explained in the “information” modal button for each indicator chart.
For shift 3 on zero-waste cities, the indicators were identified to measure two themes: the efficiency of the waste cycle process, and the effectiveness of the waste cycle process. The process includes solid and liquid waste collection, conveyance and disposal within municipal jurisdictions. Within the efficiency category, solid waste indicators track the operational capacity in managing the waste cycle by local governments responsible for collecting household and commercial wastes within their respective jurisdictions. Liquid waste indicators track the efficiency in the management of black and gray water generated by households through toilets, kitchen sinks and other plumbing appliances.
The second set in shift 3 measures the institutional effectiveness of the waste cycle process within municipal jurisdictions. In situations where solid waste management is inadequate, many communities engage in adaptive (albeit informal) practices through the efforts of numerous waste pickers. These individuals, often from the poorest segments of urban society, play a critical role in a broader, systemic approach to waste management and contribute significantly to recycling and the reduction of waste in the absence of formal systems. For liquid waste collection, conveyance and disposal, effective management takes place through water utilities responsible for publicly financed piped wastewater infrastructure that safely treats water and disposes sludge. The default outcome is onsite disposal by informal “pit emptiers” who clean septic tanks or open pits for a negotiated charge and dump the sludge in the nearest open access resource (vacant lands, informal dumpsite and waterways), often leading to pollution of aquifers and waterways.
Not every outcome indicator in the cities system has an associated target. For climate-related indicators, this is because there is no established target in the literature, but the indicator was deemed important based on a review of the literature and expert elicitation. For equity-related indicators that do not have targets, this is because there is no general agreement in the literature about quantitative methane targets. The equity indicators for the cities system were chosen based on the principles outlined in the Systems Change Lab technical note. Lack of data is also a methodological challenge affecting many of the indicators on equity.
- Buildings
See the technical note linked at the top of this web page for an explanation of the methodology underpinning the Systems Change Lab platform. This section explains how the methodology was applied in the buildings system.
Selection of Shifts
In the buildings system, we chose three shifts:
- Construct zero-carbon buildings
- Optimize building energy consumption
- Decarbonize building energy use
Buildings provide shelter, services and economic opportunity around the world. The operation of buildings contributes about 18% of global greenhouse gases (GHGs) when considering both on-site operations and the electricity and heat generated off-site to power them. Additionally, the emissions from the production of the materials that go into buildings, such as cement and steel, can be considered embodied in these buildings, increasing their emissions even more. For these reasons, buildings play an essential role in limiting climate change to 1.5 degrees C and improving equity.
Because buildings provide a venue for public and private life, they are deeply connected with several other systems: chiefly, circular economy, cities, finance, power, transport and industry. The shifts in this system were chosen for their importance to decarbonization and equity goals and are organized into three broad categories of action to decarbonize buildings.
First, lowering the carbon dioxide emissions associated with the materials that go into buildings helps reduce their embodied emissions. Next, maximizing energy efficiency and conserving energy helps minimize the emissions generated on-site or off-site. Finally, replacing carbon-intensive heating and cooling technologies as well as appliances with alternatives that can be powered without emitting GHGs helps bring emissions from buildings down to zero.
Selection of Targets and Indicators
For the first shift, the indicators were selected to measure how reducing the emissions associated with building materials, both through material substitution and through lower-carbon cement and steel production, can reduce embodied GHG emissions from buildings. This shift is primarily focused on reducing emissions. The selection of targets and indicators in the shift is described in the “information” modal button on each indicator chart.
For the second shift, the indicators were selected to show how increasing energy conservation and energy efficiency in building operations can reduce GHG emissions from buildings and also make it easier to substitute for zero-carbon solutions. This shift is primarily focused on reducing emissions, but ensuring access to energy efficiency upgrades also touches upon equity. Additionally, the number of jobs available to perform efficiency upgrades is included to measure the labor impacts of this shift. The selection of targets and indicators in the shift is explained in the “information” modal button for each indicator chart.
For the third shift, the indicators were identified to measure the substitution of carbon-intensive technologies for heating, cooling and appliances with zero-carbon alternatives. This shift is primarily focused on reducing emissions, but the number of jobs available to install zero-carbon technologies is included to measure the labor impacts of this shift. The selection of targets and indicators in the shift is explained in the “information” modal button for each indicator chart.
Not every outcome indicator in the buildings system has an associated target. For climate-related indicators, this is because there is no established target in the literature but the indicator was deemed important based on a review of the literature and expert elicitation. For equity-related indicators that do not have targets, this is because there is no general agreement in the literature about quantitative targets, as there is no widely agreed-upon equity or just transition scenario akin to 1.5 degrees C. The equity indicators for the buildings system were chosen based on the principles outlined in the Systems Change Lab technical note. Lack of data is also a methodological challenge affecting many of the indicators on equity.
Future work
There are several issues that will be addressed in future iterations of the Systems Change Lab platform. These include targets for system-wide shifts as well as equity-related indicators and targets. Future updates may track progress for integrating buildings into energy systems. Equity is currently underrepresented in the system and an equity shift may be added with, for example, indicators around housing access, informal housing, floor area per capita, financial constraints and access to clean cooking. Indicators for building occupant behavior change, improvements in energy efficiency of major household appliances, the adoption of passive design measures and regulations around retrofitting, among others, will also be considered in subsequent updates.
- Economics
See the technical note linked at the top of this web page for an explanation of the methodology underpinning the Systems Change Lab platform. This section explains how the methodology was applied in the economic system.
Selection of Shifts
In the economic system, we chose three shifts:
- Integrate new prosperity metrics into economic planning and policymaking
- Embed climate, nature and equity into economic analysis
- Transform economic policies to accelerate action for climate, nature and equity
The way that the global economy works — including its typical patterns of production, consumption and distribution — is not sustainable. Every one of the systems on the Systems Change Lab platform requires transformations of these patterns. In the economic system, we focus on how to transform society’s way of thinking about, understanding and guiding the global economy.
Economic goals and metrics are restricted to governments, international institutions and businesses; economic models are restricted to those that governments and international institutions use to guide economic development; and public policies are restricted to fiscal policies and public sector investment.
The shifts in this system were chosen to reflect three interconnected and critical dimensions of a paradigm shift in economic thinking that can ultimately enable more rapid transformations in other systems (Laybourn-Langton and Jacobs 2018). Mainstreaming well-being, equity and sustainability goals alongside economic goals in economic planning helps decision-makers to develop better targeted and more effective public policies. Similarly, shifting to and scaling more fit-for-purpose economic analytical approaches that better incorporate climate, nature and equity dimensions can help decision-makers better understand and predict the functioning of the economy and help to design more effective, targeted and transformational public policies and investments aligned with economic planning goals.
To recognize the complexity of this system and the diversity of needs of different countries, shifts and indicators for this system were chosen to highlight key areas of global convergence. This was based on a thorough literature review and expert consultations. Shifts and indicators will be revisited over time.
Selection of Targets and Indicators
For the first shift, the indicators were selected to measure governments, international institutions and businesses that are actively embedding well-being, equity and sustainability goals and related metrics into economic planning, strategies and policymaking. Indicators in this shift also track global progress on addressing GDP’s continued dominance as a policy goal. Advancing “beyond GDP” metrics will likely require adjusting the UN’s System of National Accounts (SNA) and/or its satellite accounts, which will require support from countries and international institutions (Hoekstra 2020; Kaufmann et al. 2023; Masood 2022; Stiglitz et al. 2008). Media outlets can also support shifting the narrative on what constitutes economic prosperity and public policy success by reporting on well-being, equity and sustainability metrics. This shift also highlights the level of public support for using alternative prosperity indicators to understand national prosperity, which can influence policymaking. The selection of indicators for shift 1 is described in the “information” modal button on each indicator chart.
For the second shift, indicators focus on the need for governments and international financial institutions to mainstream climate, nature and equity considerations into economic analytical approaches for informing economic and development policy questions (Barbrook-Johnson et al. 2023; Dasgupta 2021; Grubb et al. 2021; IPBES 2022; Mercure et al. 2019; Stern 2022). This shift also recognizes the importance of training economists on new and diverse economic schools of thought that seek to address the global challenges of climate change, nature and biodiversity loss and social inequity, and the importance of highlighting these challenges in mainstream economic journals. This shift does not have an outcome indicator because we assume that economic models and tools ultimately influence economic policies. The selection of indicators for shift 2 is explained in the “information” modal button for each indicator chart.
For the third shift, indicators focus on fiscal policies or the use of government spending and taxation measures to address climate change, protect biodiversity and improve equity. Indicators in this shift focus on three main fiscal policy measures: repurposing environmentally harmful subsidies; pricing greenhouse gas emissions and other environmental harms; and greening public investment for innovation, green jobs, supporting marginalized communities and promoting environmentally-beneficial activities (Horton and El-Ganainy n.d.; OECD 2021; UNEP 2021). The finance system covers public investment as well as investment targets and indicators, while this system is focused more directly on public finance that deals with revenues and expenditures. Other economic policy domains, like monetary, trade, industrial and labor policy, are just beginning to incorporate climate and nature, so they are not covered yet in this system (Fricke et al. 2023; Gronchi et al. 2021; Kenter et al. 2022).
Works Cited
Barbrook-Johnson, P., S. Sharpe, R. Pasqualino, S. de Moura, F. Nijsee, P. Vercoulen, A. Clark, et al. 2023. “New Economic Models of Energy Innovation and Transition: Addressing New Questions and Providing Better Answers.” The Economics of Energy Innovation and System Transition.
Costanza, R., R. Hoekstra, J. Eastoe, and I. Rum. 2024. “Measuring What Matters: A Synthesis of Models, Metrics, and Policies for a Sustainable and Inclusive Wellbing Future.” MERGE. https://mergeproject.eu/synthesis/.
Dasgupta, P. 2021. The Economics of Biodiversity: The Dasgupta Review: Full Report. London: HM Treasury.
Fricke, T., X. Likaj, B.Buchholtz, S. Hennen, T. Krebs, and D. Kläffling. 2023. “Mapping the State of a Shifting Paradigm.” Forum for a New Economy. https://newforum.org/en/studie/mapping-the-state-of-a-shifting-paradigm/.
Gronchi, I., J. Jousilahti, J. Leppanen, N. Lancaster, J. Nuutinen, R. Saramaki, A. Vourdaki, S. Buckton, J. Kenter, and S. Martino. 2021. “Turning the Tide – Landscape Analysis of an Emergent Economic Movement in Europe.” Demos Helsinki, Laudes Foundation, Partners for a New Economy, GANE, and One Project.
Grubb, M., P. Drummond, J.F. Mercure, C. Hepburn, P. Barbrook-Johnson, J.C. Ferraz, A. Clark, et al. 2021. “The New Economics of Innovation and Transition: Evaluating Opportunities and Risks.” Economics of Innovation and System Transition Consortium.
Hoekstra, R. 2020. “Measuring the Wellbeing Economy: How to Go Beyond-GDP.” Wellbeing Economy Alliance.
Horton, M., and A. El-Ganainy. n.d. “Fiscal Policy: Taking and Giving Away.” IMF Finance and Development Magazine. https://www.imf.org/en/Publications/fandd/issues/Series/Back-to-Basics/Fiscal-Policy.
IPBES (Intergovernmental Science-Policy Platform on Biodiversity and Ecosystem Services). 2022. “Summary for Policymakers of the Methodological Assessment Report on the Diverse Values and Valuation of Nature of the Intergovernmental Science-Policy Platform on Biodiversity and Ecosystem Services.” Bonn, Germany: IPBES Secretariat.
Kaufmann, R., J. Barth, L. Steffens, L.A. Le Lannou, A. Gerer, and S. Kiecker. 2023. “Mainstreaming Wellbeing and Sustainability in Policymaking: Technical and Governance Levers out of the Institutional GDP Lock-In.” ZOE Institute for Future-Fit Economics.
Kenter, J., S.J. Buckton, S. Martino, B. Agarwal, R. Costanza, A. Anger-Kraavi, A.P. Hejnowicz, et al. 2022. “Ten Principles for a New Economics in a Time of Global Crises.” Nature Sustainability.
Laybourn-Langton, L., and M. Jacobs. 2018. “Paradigm Shifts in Economic Theory and Policy.” Intereconomics 53 (3): 113–18. https://doi.org/10.1007/s10272-018-0737-4.
Masood, E. 2022. “GDP is getting a makeover — what it means for economies, health and the planet”. Nature. https://www.nature.com/articles/d41586-022-03576-w.”
Mercure, J.F., F. Knobloch, H. Pollitt, L. Paroussos, S. Serban Scrieciu, and R. Lewney. 2019. “Modelling Innovation and the Macroeconomics of Low-Carbon Transitions: Theory, Perspectives and Practical Use.” Climate Policy 19 (8): 1019–37. https://doi.org/10.1080/14693062.2019.1617665.
OECD (Organisation for Economic Co-operation and Development). 2021. “Tracking Economic Instruments and Finance for Biodiversity.” OECD.
Stern, N. 2022. “A Time for Action on Climate Change and a Time for Change in Economics.” The Economic Journal 132 (644): 1259–89. https://doi.org/10.1093/ej/ueac005.
Stiglitz, J.E., A. Sen, and J.P. Fitoussi. 2008. “Report by the Commission on the Measurement of Economic Performance and Social Progress.” Paris, France: Commission on the Measurement of Economic Performance and Social Progress.
UNEP (United Nations Environment Programme). 2021. “State of Finance for Nature.” Nairobi, Kenya: UNEP. https://www.unep.org/resources/state-finance-nature.
- Food and Agriculture
See the technical note linked at the top of this web page for an explanation of the methodology underpinning the Systems Change Lab platform. This section explains how the methodology was applied in the food and agriculture system.
Selection of Shifts
In the food and agriculture system, we chose three shifts:
- Increase agricultural productivity sustainably, resiliently and without expanding into high-carbon, biodiverse ecosystems
- Reduce food loss and waste
- Ensure access to and adoption of healthier, more sustainable diets for all
Creating a sustainable food future for all will require transforming the food system to feed nearly 10 billion people by 2050 and provide farmers and farming communities with just and equitable levels of human well-being. At the same time, these efforts must limit agricultural expansion into high-carbon, biodiverse ecosystems, improve the resilience of agricultural systems, reduce on-farm greenhouse gas (GHG) emissions and minimize other environmental harms. For the focus of this platform — to address the climate and biodiversity crises while building a more just and equitable economy in the process — three dimensions of the food system need to be addressed.
First, agricultural productivity needs to be increased to meet the demands of a growing population in the face of intensifying climate impacts and without expanding croplands, pasturelands or land dedicated to aquaculture farms (Clark et al. 2020a; IPCC 2019, 2022; Ivanovich et al. 2023; Searchinger et al. 2019). These productivity increases must be achieved at the same time as on-farm GHG emissions and biodiversity losses are minimized. This may include, for instance, changing agricultural management to reduce the overuse of pesticides and fertilizers, increase water use efficiency, adopt practices that improve soil health and re-establish habitat diversity and connectivity, among others (IPBES 2018; 2019; 2022).
Second, minimizing food loss and waste can decrease the amount of land, GHG emissions, water, fertilizers and pesticides needed to produce sufficient food for a growing population (Clark et al. 2020a; IPCC 2019, 2022; Ivanovich et al. 2023; Searchinger et al. 2019). These changes can, in turn, reduce the associated impacts of agricultural production on people and nature.
Third, shifting to healthier and more sustainable diets is necessary to improve health outcomes and decrease the climate and biodiversity impacts of food production. This includes, for instance, improving nutrition in low-income and under-consuming populations and shifting diets of high-consuming populations away from emissions- and land- intensive foods like beef and toward more plant-based foods (Clark et al. 2020b; IPCC 2019, 2022; Ivanovich et al. 2023; Searchinger et al. 2019).
Accelerating these shifts over the next three decades can help transform the global food system to address the sustainable development, climate and biodiversity crises the world currently faces.
Selection of Targets
Identifying 1.5°C-compatible targets
For each of these three critical shifts, we primarily adopted targets established in Creating a Sustainable Food Future (Searchinger et al. 2019). For that publication, the French Agricultural Research Centre for International Development, French National Institute for Agriculture, Food and Environment, World Resources Institute and Princeton University jointly developed a global accounting and biophysical model called GlobAgri-WRR to quantify the effects of food production and consumption patterns on agricultural land-use demands, GHG emissions and food security. Searchinger et al. (2019) then modeled several detailed scenarios to see which one would achieve three overarching goals by 2050:
- Feed nearly 10 billion people.
- Reduce agriculture’s land footprint below its 2010 global extent to eliminate GHG emissions and minimize biodiversity losses from agricultural land-use change, and free up enough farmland for ecosystem restoration to reverse biodiversity losses, enhance carbon sequestration and avoid further emissions.
- Limit GHG emissions from agricultural production to no more than 4 gigatonnes of carbon dioxide equivalent per year (GtCO2e/yr). This limit falls within the interquartile range (3.4 GtCO2e/yr-6.6 GtCO2e/yr) of GHG emissions from the agricultural sector in 2050 across a filtered subset of 24 scenarios that limit warming to 1.5 degrees C (2.7 degrees F) with no or limited overshoot from integrated assessment models examined in the IPCC’s Sixth Assessment Report. These scenarios do not transgress key environmental and social safeguards and incorporate equity considerations by ensuring that GHG emissions declines are steeper in developed countries than in developing countries. The same 24 scenarios were used to establish targets for the buildings, industry, and transport systems, as described in Box 2 by Schumer et al. (2025). This also assumes that emissions are simultaneously reduced across other sectors.
Of all scenarios modeled in Searchinger et al. (2019), only the most ambitious “Breakthrough Technologies” scenario achieved all three goals. In total, this scenario includes more than 15 activities, or mitigation measures, that focus on reducing growth in demand for food and other agricultural products, increasing food production without expanding agricultural land, and lowering GHG emissions from agricultural production. These activities account for a significant percentage of the mitigation potential identified in Searchinger et al. (2019) and that can help prevent agricultural expansion, which is the leading driver of terrestrial biodiversity loss.
We then translated these activities into near- and long-term targets. To track progress toward targets adapted from the GlobAgri-WRR model in Searchinger et al. (2019), we needed to use historical values annually reported by FAOSTAT, which slightly differ from the GlobAgri-WRR values. Therefore, we adapted the targets by scaling the values for indicators published in Searchinger et al. (2019) and FAOSTAT. This consisted of comparing the 2010 data across both sources and normalizing the GlobAgri targets to account for the discrepancy with FAOSTAT. We then calculated the mean between observed values for indicators in 2010 and the 2050 projection for these indicators in the “Breakthrough Technologies” scenario, effectively creating a linear pathway between the observed value in 2010 and the target in 2050. We then set our near-term target for 2030 from that pathway. Finally, to be more current, we updated the baseline year from 2010 to 2017.
GlobAgri-WRR is not the only model to have established 1.5 degrees C-aligned targets for the food system. In instances where other targets have been established for individual indicators, we have included a discussion of how these targets compare to other targets in the indicator’s metadata.
Identifying targets to minimize biodiversity losses and advance equity
For targets that focus more on reducing biodiversity losses (e.g., reducing pollution) and other equity dimensions (e.g., nutrition and food security) that are not captured in Searchinger et al. (2019), we first reviewed academic literature published within the past five years to identify relevant quantitative, timebound targets (note that, in some instances, we needed to rely on the underlying source papers that were published more than five years ago). Not only did we often encounter a lack of scientific consensus on what constitutes an ambitious target, but we also found that the scientific literature generally lacks quantitative, time-bound targets. Several highly cited articles have highlighted this research gap and proposed aspirational targets based on expert judgement (e.g., Diaz et al. 2020, Dinerstein et al. 2019, Garibaldi et al. 2021). We considered those aspirational targets alongside the Sustainable Development Goals (SDGs), as they often align with and complement each other.
The 17 SDGs, adopted in 2015 by all UN Member States, provide an agenda to achieve positive change toward peace and prosperity for people and the planet by 2030. They represent a call for action by all countries to develop global partnerships and integrative and equitable solutions to major challenges such as poverty, hunger, disease, biodiversity loss, climate change and economic crises — many of which relate directly or indirectly to agriculture and food systems. For example, SDG targets 2.4 and 2.5 aim to ensure sustainable food production that helps maintain ecosystems and enhance land and soil quality and capacity for adaptation to climate change. As another example, target 6.4 aims to increase water use efficiency and address water scarcity.
In cases where we did not find a quantitative, time-bound target, we defaulted to a qualitative, directional target (i.e., increase or decrease) informed by the scientific literature.
Selection of Barriers and Enabling Conditions
After selecting the key climate, biodiversity and equity targets for food and agriculture, we reviewed the academic literature to identify critical barriers to transformational change, as well as key enabling conditions that may help decision-makers surmount such obstacles to achieve near- and long-term targets. We conducted these literature reviews in English and constrained the dates of our searches from 2015 to 2023. For some indicators, however, analysis of this recent body of literature suggested that several highly cited and seminal papers were published prior to 2015. In such instances, we included those studies in our review. Repositories used include Google Scholar and EBSCO. We also searched for recent publications directly from the websites of independent research institutions, United Nations agencies and high-level sectoral coalitions. We acknowledge that because we conducted our literature review in English, there is a potential bias toward knowledge generated by those in the Global North.
We primarily selected barrier categories and enabling condition indicators that correspond directly to our targets. We erred on the side of being comprehensive and included indicators covering the main categories of barriers and enabling conditions presented in academic literature (especially review papers wherever possible). In the case of enabling conditions, we focused on those within the five overarching categories previously identified by Systems Change Lab as critical to advancing systemic change: innovation, regulations and incentives, strong institutions, leadership from key change agents, and shifts in behavior and social norms. We then relied on two rounds of expert feedback from peer reviewers to refine the list of indicators as appropriate.
The enabling conditions selected are by no means exhaustive in terms of illustrating the complex set of factors that can support global efforts to overcome key barriers to transformational food system change and achieve each target. However, the ones highlighted on this platform represent a subset of recommended interventions prioritized in the literature and by expert judgment.
Additionally, some indicators could not be tracked directly; for those, we selected the best available proxy indicators. We provide additional details on proxy indicators used in each relevant indicator and identify the use of a proxy in indicator titles by saying “indicator name [the ideal indicator], as measured by [the proxy indicator].”
Works Cited
Clark, Michael A., Nina G. G. Domingo, Kimberly Colgan, Sumil K. Thakrar, David Tilman, John Lynch, Inês L. Azevedo, and Jason D. Hill. 2020a. “Global Food System Emissions Could Preclude Achieving the 1.5° and 2°C Climate Change Targets.” Science 370 (6517): 705–8. doi:10.1126/science.aba7357.
Clark, Michael, Jennie Macdiarmid, Andrew D. Jones, Janet Ranganathan, Mario Herrero, and Jessica Fanzo. 2020b. “The Role of Healthy Diets in Environmentally Sustainable Food Systems.” Food and Nutrition Bulletin 41 (2_suppl): 31S-58S. doi:10.1177/0379572120953734.
Díaz, Sandra, Noelia Zafra-Calvo, Andy Purvis, Peter H. Verburg, David Obura, Paul Leadley, Rebecca Chaplin-Kramer, et al. 2020. "Set ambitious goals for biodiversity and sustainability." Science 370 (6515): 411-413. doi:10.1126/science.abe1530.
Dinerstein, Eric, Carly Vynne, Enric Sala, Anup R. Joshi, Sanjiv Fernando, Thomas E. Lovejoy, Juan Mayorga, et al. 2019. "A global deal for nature: guiding principles, milestones, and targets." Science Advances 5 (4). doi:10.1126/sciadv.aaw2869.
Garibaldi, Lucas A., Facundo J. Oddi, Fernando E. Miguez, Ignasi Bartomeus, Michael C. Orr, Esteban G. Jobbágy, Claire Kremen, et al. 2021. "Working landscapes need at least 20% native habitat." Conservation Letters 14 (2). https://doi.org/10.1111/conl.12773.
IPBES (Intergovernmental Science-Policy Platform on Biodiversity and Ecosystem Services). 2018. “The IPBES Assessment Report on Land Degradation and Restoration.” Zenodo. doi:10.5281/zenodo.3237393.
IPBES. 2019. “Global Assessment Report on Biodiversity and Ecosystem Services of the Intergovernmental Science-Policy Platform on Biodiversity and Ecosystem Services.” Zenodo. doi:10.5281/zenodo.6417333.
IPBES. 2022. “Assessment Report on the Sustainable Use of Wild Species.” www.ipbes.net/sustainable-use-assessment.
IPCC (Intergovernmental Panel on Climate Change). 2019. Climate Change and Land: An IPCC Special Report on Climate Change, Desertification, Land Degradation, Sustainable Land Management, Food Security, and Greenhouse Gas Fluxes in Terrestrial Ecosystems, edited by P.R. Shukla, J. Skea, E.C. Buendia, V. Masson-Delmotte, H.-O. Pörtner, D.C. Roberts, P. Zhai, et al. Cambridge: Cambridge University Press. “Chapter 5 : Food Security.” www.ipcc.ch/srccl/chapter/chapter-5/.
IPCC. 2022. Climate Change 2022: Mitigation of Climate Change. Contribution of Working Group III to the Sixth Assessment Report of the Intergovernmental Panel on Climate Change, edited by P.R. Shukla, J. Skea, R. Slade, A. Al Khourdajie, R. van Diemen, D. McCollum, M. Pathak, et al. Cambridge: Cambridge University Press. www.ipcc.ch/report/ar6/wg3/.
Ivanovich, Catherine C., Tianyi Sun, Doria R. Gordon, and Ilissa B. Ocko. 2023. “Future Warming from Global Food Consumption.” Nature Climate Change 13 (3): 297–302. doi:10.1038/s41558-023-01605-8.
Searchinger, Tim, Richard Waite, Craig Hanson, Janet Ranganathan, Patrice Dumas, and Emily Matthews. 2019. “World Resources Report: Creating a Sustainable Food Future – A Menu of Solutions to Feed Nearly 10 Billion People by 2050.” Washington, DC: World Resources Institute. www.sustainablefoodfuture.org.
- Governance
See the technical note linked at the top of this web page for an explanation of the methodology underpinning the Systems Change Lab platform. This section explains how the methodology was applied in the governance system.
Selection of Shifts
For the governance system, we chose six shifts:
- Enable a safe and secure environment for workers, civil society and communities
- Ensure transparency and access to information
- Guarantee access to justice
- Promote government accountability and anti-corruption measures
- Ensure inclusive citizen participation in policymaking and political processes
- Strengthen government capacity to implement commitments fairly and effectively
This system understands “governance” according to the United Nations Development Programme’s definition: “the system of values, policies and institutions by which a society manages its economic, political and social affairs through interactions within and among the state, civil society and private sector. It is the way a society organizes itself to make and implement decisions — achieving mutual understanding, agreement and action” (UNDP 2025).
Governance includes legal frameworks that establish the rights and responsibilities of government, civil society, and the private sector; structures for coordinating across government and between national and subnational entities; as well as the financial, technical, and human capacity to implement policies effectively. Governance is also about the distribution of power across society, through formal laws and social-cultural norms, networks, relationships between key actors, and political constituencies.
Given that many countries have failed to act ambitiously or decisively enough on systemic challenges relating to climate, nature, and social equity — due in part to the political power of vested interests — the role of political economy in governance cannot be ignored, even if it does not lend itself easily to direct measurement.
In the governance system, we therefore chose six shifts that would lead to policies and actions that respect human rights, are transparent, participatory, and accountable, and are supported by credible institutions with capacity and minimal corruption. Indicators were then developed based on aggregating information from established global databases or indices, rooted in credible methodologies.
There is evidence that recognition and protection of rights, coupled with political support for their enforcement, enables better policy outcomes. For instance, poor and marginalized groups face more issues accessing the justice system and costly access to justice is a drain on the economy (OGP 2022a). Fiscal openness reduces corruption and leads to more revenue and better government services (OGP 2022b).
Governance includes legal frameworks that establish the rights and responsibilities of government, civil society, and the private sector; structures for coordinating across government and between national and subnational entities; as well as the financial, technical, and human capacity to implement policies effectively. Governance is also about the distribution of power across society, through formal laws and social-cultural norms, networks, relationships between key actors, and political constituencies.
Protecting civil liberties is also closely associated with economic growth — countries that improved their scores on the Varieties of Democracy Index experienced higher per capita GDP growth (The B Team 2018). While there are some cases of countries with sustained economic growth where political and social rights are more limited — such as China, Vietnam, Ethiopia, and Rwanda — corruption and weak rule of law can lead to poor environmental, social, and economic outcomes in nominal democracies. However, protecting the right to shape and challenge decisions that impact nature, climate, and the health and vitality of communities is critical to positive systems change.
Our framework is aligned with other multistakeholder efforts to assess governance and environmental rule of law. For nstance, the World Bank’s World Development Report 2017, “Governance and the Law,” underlines the importance of understanding power asymmetries in the policy arena and how they undermine legal frameworks, as well as shifting incentives, promoting contestability of decision-making, and shaping preferences and beliefs (World Bank 2017).
Our framework is also aligned with the United Nations Environment Programme’s (UNEP) “Environmental Rule of Law Report,” which distinguishes between rule of law and governance by positing that environmental governance “encompasses a broader range of principles and approaches that relate to how decisions are taken and implemented in relation to the environment,” while environmental rule of law “focuses particularly on implementation, compliance and enforcement” (UNEP 2023). Our approach seeks to include indicators that assess both.
The shifts selected for this system underpin governance that respects the human rights of all people, checks and balances on power across government and society, and capacity and willingness to deliver policies and programs that are equitable and inclusive. Achieving these shifts would represent governance that prioritizes equity, accountability, civil liberties, and the belief that institution-building and delivery of public goods for present and future generations is more politically sound than channeling benefits to economic and political elites.
We focused these shifts on country-level governance rather than international governance, such as the effectiveness of multilateral forums, for two main reasons. First, while international agreements provide important architecture for cooperation, the degree of cooperation and ambition rests primarily on domestic politics and governance. In this context, it is important to highlight the wide divergence in power and influence that different countries have in the global arena, with institutions, capacities, and policy choices shaped by external forces (e.g., indebtedness, commodity, or aid-dependence). On top of this, there is a notable lack of useful and measurable indicators of effectiveness for international forums.
The shifts presented here reflect a view that climate change and loss of ecosystems, habitat, and biodiversity will have adverse impacts across human systems, but disparate impacts on those groups with fewer resources (economic, social, or political) or adaptive capacity. Also, concentrated political and economic power is a major driver of these threats and thus must be considered in how solutions are designed and implemented. Therefore we include measures of how effectively citizens can participate in decisions, use information, and potentially hold governments accountable, in addition to critical measures of state capacity. Most indicators presented here are not sector specific, both because those indicators are rare in global datasets and because underlying governance measures can still help explain why policy targets are not being set or achieved. Since Systems Change Lab also seeks to assess social equity, a wider view of governance is important. For example, transparency and accountability are important in delivering health or education outcomes as well as climate.
This is not to say that there are no specific governance challenges of responding to climate, biodiversity, and equity challenges. The degree of uncertainty in magnitude and timing of climate impacts the nature of interactions between atmospheric, ecological, and social systems, and others.
Selection of Indicators
There is no one size fits all measurement of political leadership or supportive political economy for systems transformation. However, the indicators within this system are biased toward de facto measures that give some indication of political commitment toward state capacity building, a transparent and inclusive policymaking environment, accountability, and a broader enabling environment for media, civil society, and pluralistic society. That said, users interested in the policy outcomes of these governance measures should refer to indicators assessing performance of policy measures, investments, and other actions in relevant sectoral systems.
While the presence of de jure factors is straightforward to identify, many de facto considerations must rely to some degree on subjective methodologies such as expert coding and polling. For instance, the degree to which actors are committed to implementing mandates consistently and fairly, the justice system is free from corruption, or how effectively different members of society can influence decisions that impact them are all subjective assessments. Fortunately, there are well-established, rigorous methodologies which, despite not being specifically on the governance of climate or biodiversity, still provide valuable and relevant proxies.
Governance indicators rarely, if ever, have time-bound targets for reaching goals. This doesn’t mean that policymakers and advocates are not striving for full implementation, but recognizes that governance is a product of institutions, economic vitality, and culture, and meeting time-bound targets may be unrealistic. The relative weight of each of these in driving governance outcomes will vary for different indicators and is still somewhat subjective. Instead, we indicate the directional trend of the indicators over time in relation to the maximum possible score in the data source.
Indicators were developed first by identifying critical components within shifts, and then identifying proxies for which there already existed global data sources or data sources that could be made global. We acknowledge the limitation of not using country- or region-specific data sources — such as the Ibrahim Index of African Governance — in order to ensure consistency with the rest of Systems Change Lab in that an indicator could feasibly include any country.
There are indicators within this system that were included despite not having a data source. These indicators were deemed to be relevant and important and potentially could be addressed through additional data collection and analysis. To account for this, we selected established proxies from governance indices or other platforms with well-established methodologies and greater than 50% global coverage. These included the World Justice Project Rule of Law Index, Varieties of Democracy, Civicus Monitor, Business and Human Rights Resource Centre, Corruption Risk Transparency Index, Reporters Without Borders World Press Freedom Index, ITUC Global Rights Index, Berggruen Index, Global Data Barometer, the United Nations (multiple agencies), and Rights and Resources. We chose not to use the broad measures in Worldwide Governance Indicators since they produce scores aggregating multiple different methodologies; however, some of the data sources mentioned above are included in their indices.
In selecting them, we tried to rely on specific, actionable indicators with well-established methodologies (of at least two to three years of time series, if not more), rather than more aggregated indices. While some indicators in this system assess the presence of some quality of governance — for instance, conflict of interest disclosure — many indicators assessing “governance quality,” such as checks and balances or judicial independence, rely on national surveys, expert panels, or mixed methods approaches to produce scores along an ordinal continuum.
Where data sources divided scores into distinct and meaningful categories, we have included performance thresholds to indicate which countries are demonstrating governance performance that is likely sufficient to enable systems change in other systems. Ultimately, we understand that some users may disagree and find these thresholds too high or too low. Where scores are continuous, we have presented global averages and users can view by region or country.
Identifying governance shifts and data sources to track systems change
The shifts and indicators within the governance system reflect the approach above with some important caveats.
Since governance is about the allocation of power and resources to set priorities, make decisions, and implement actions, it cannot be disentangled from political economy — i.e., how rules and norms intersect with the interests and incentives of elite actors and social groups in allocating resources and power.
We also acknowledge that a lively debate exists on the instrumental value of democratic norms and political rights in achieving transformative policy change for people, nature, and climate, given the challenges and setbacks that many countries with these political systems have endured in meeting commitments to the Sustainable Development Goals, Paris Agreement, and other global goals (Kulaeva 2025). But neither have authoritarian governments successfully achieved these critical global goals.
Given the inherent injustices and disparities that climate change, deforestation, extractivism, and inequality have on the politically and socially marginalized, natural resource-dependent communities, and Indigenous Peoples, we believe it’s important to continue to monitor whether and how civil society can exercise checks on power.
Works Cited
Kulaeva, Z. 2025. “Normative Implications Examining the Case for a Democratic Versus an Authoritarian Environmental Approach to Addressing Climate Change: A Systematic Review of the Published Evidence, 2000-2022.” Sustainable Environment 11 (1). https://doi.org/10.1080/27658511.2025.2505328.
OGP (Open Government Partnership). 2022a. “The Skeptic’s Guide to Open Government: Access to Justice.” https://www.opengovpartnership.org/skeptics-guide-to-open-government-2022-edition/#toc_1.
OGP. 2022b. “The Skeptic’s Guide to Open Government: Fiscal Openness.” https://www.opengovpartnership.org/skeptics-guide-to-open-government-2022-edition/#toc_2.
The B Team. 2018. “The Business Case for Protecting Civic Rights,” October 15. https://www.bteam.org/our-thinking/reports/the-business-case-for-protecting-civic-rights.
UNDP (United Nations Development Programme). 2025. “Governance and peacebuilding: Responsible and accountable institutions.” https://www.undp.org/eurasia/our-focus/governance-and-peacebuilding/responsible-and-accountable-institutions.
UNEP (United Nations Environment Programme). 2023. Environmental Rule of Law: Tracking Progress and Charting Future Directions. Nairobi: UNEP. https://wedocs.unep.org/bitstream/handle/20.500.11822/43943/Environmental_rule_of_law_progress.pdf?sequence=3.
World Bank. 2017. World Development Report 2017: Governance and the Law. Washington, DC: World Bank. https://www.worldbank.org/en/publication/wdr2017.