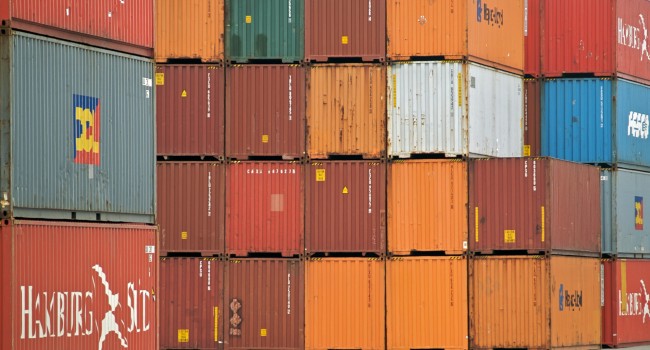
To build a circular economy we must address the entire lifecycle of a product, including the end-of-use stage. When a product can no longer be used for its original purpose, recoverable materials and components in waste should be separated from waste streams and prepared for reuse or recycling in order to reduce the use of virgin resources. Increasing recycling and reuse rates is a key step to achieving circularity. However, if the quality and value of materials and components are not considered properly, diverted materials and components from waste will be contaminated and not used at all, or will be used for low-grade purposes such as backfilling holes in excavated areas. This wastes the potential economic benefits of the materials.

Overall, recycling rates are increasing for the countries with data available, but centralized and periodically-updated data is only available for the European Union (EU) and countries in the Organisation for Economic Co-operation and Development (OECD). The recycling of municipal waste, which includes household waste, increased from 24% in 2000 to only 34% in 2020 in the OECDThe European Union (EU) achieved 48% in 2022, but even this remains below their policy target of 60% in 2030. More efforts in recycling are necessary.

However, we cannot precisely assess the current status of recycling in the world. First, the recycling data of total waste is limited because many countries only track data for recycling of specific waste streams. Second, the data availability differs significantly across countries and regions. Third, different definitions of recycling rates makes it difficult to compare and put together recycling data.

Enablers and barriers 

This shift aims to not only increase the amount of recycling and component reuse at end-of-use stages, but also to improve the quality and retain the value of these materials. In this regard, it is important to design products so that they are easy to disassemble and recycle. It is also important that the recycler uses cleaner sorting and separation processes and avoids contamination of the materials with impurities.

Several actions can help to accelerate progress in increasing the quantity and quality of reuse and recycling. This includes behavior change around sorting recyclables, regulations and incentives to increase reuse and recycling and improve the quality of recovered materials, and leadership from change agents. For example, deposit-refund and pay-as-you-throw schemes are policy instruments that incentivize stakeholders for a better sorted collection. The EU’s ecodesign regulation is one example of also spurring manufacturers to make products easier to recycle and disassemble. Extended producer responsibility can further incentivize manufacturers to design their products for better recycling. Additionally, stakeholder collaboration between manufacturers, retailers, waste collectors and recyclers can create effective collection and recycling schemes of waste products.

Data Insights

What targets are most important to reach in the future?

Systems Change Lab identifies 9 targets toward which to track progress. Click a chart to explore the data.

What factors may prevent or enable change?

Systems Change Lab identifies 5 factors that may impede or help spur progress toward targets. Click a chart to explore the data.

Progress toward targets

Systems Change Lab tracks progress toward 9 targets. target. Explore the data and learn about key actions supporting systems change.

Amount of recovered parts used for remanufacturing and other processes

Parts and components reused for remanufacturing or other processes can reduce the use of new resources, production cost and associated energy consumption while simultaneously yielding larger economic profits.

In a circular economy, it is expected that resource circulation occurs at as high an economic value as possible, retaining functionality of parts/components in waste products. An emerging example is that parts and components are reused for remanufacturing. Another example is to use them as spare parts for repairing existing products. These practices can reduce the use of new resources, production cost and associated energy consumption while simultaneously yielding larger economic profits.

The share of remanufacturing business, in terms of turnover in sectors with existing remanufacturing practices, was estimated to be 1.9% in 2015 in the European Union, while remanufacturing activities generated sales of 30 billion euros and employment of 190,000 people. Remanufacturing has appeared in many sectors, including automobile, aerospace, electrical and electronic equipment, medical equipment, machinery and more. The United States, Germany, the United Kingdom, the Netherlands and France have been the biggest remanufacturers so far, and Brazil, India and China have growing remanufacturing activities.

The remanufacturing industry is expected to grow. However, there is no centralized or publicly available data source that can provide the data for this indicator. Efforts to facilitate data collection and make the resulting data publicly available are necessary.

Reuse and recycling rate of end-of-life vehicles

The reuse of parts and recycling of materials from end-of-life vehicles is important, as vehicles are heavy consumer products that use various valuable materials as well as polluting substances such as oil and heavy metals.

The reuse of parts and recycling of materials from end-of-life vehicles is important, as vehicles are heavy consumer products that use various valuable materials as well as polluting substances such as oil and heavy metals.

The average reuse and recycling rate of end-of-life vehicles in the European Union (EU) increased from 84.6% in 2012 to 89.1% in 2020. In most EU countries, this rate exceeded 85% in 2020, and in 14 countries it exceeded 90%. Progress in lagging countries remains a challenge. Another challenge is to increase the proportion of reuse in the rate to retain the highest value of automobile parts, such as used lithium-ion batteries and neodymium magnets, on top of recycling them. Centralized data is not available for non-EU countries.

Reuse and recycling of e-waste per capita

The amount of e-waste is increasing, ending up in landfills without recycling or being dumped illegally or improperly, even though it contains hazardous substances. This challenge is even greater in developing countries.

Electrical and electronic waste, or “e-waste,” has drawn the attention of waste management legislators around the world for the last two decades. The amount of e-waste is increasing, ending up in landfills without recycling or being dumped illegally or improperly, even though it contains hazardous substances. This is especially evident in developing countries. People also use and own more electronic equipment, such as smartphones and tablets, than ever, making proper handling and recycling of e-waste increasingly necessary.

Per capita reuse and recycling of e-waste, measuring the reuse of parts and the recycling of materials, increased from 5.5 kilograms (kg) in 2012 to 8.8 kg in 2020 in the European Union (EU). This trend is positive, but there are discrepancies between countries. The 2020 rates in European countries ranged from 3.6 kg to 17.7 kg per capita. For non-EU countries, the rates around 2016 ranged from less than 0.1 kg to 16.8 kg per capita. Korea and Japan had relatively high rates of over 4 kg per capita, followed by the the United States, Canada and Australia, each with more than 2 kg per capita. The rates from 23 countries in Latin America, Asia, Africa and other regions were all less than 1 kg per capita. Establishing effective collection in lagging countries is a key step in managing e-waste. For the leading countries, increasing the reuse rate and the use of recycled materials in more valuable ways are still challenges.

It is important to note that this indicator is on a per capita basis. Therefore, if per capita e-waste recycling is increasing, it could be not because the recycling rate is increasing, but rather because people are generating more e-waste in total. A per capita indicator was selected due to the difficulty of estimating the total e-waste generation accurately for many countries in the world. 

Reuse and recycling rate of construction and demolition waste

Construction and demolition waste accounts for a large fraction of total waste, and while many developed countries have achieved a high recovery rate, some developing countries are still struggling with this large amount of waste.

Construction and demolition waste accounts for a large fraction of total waste. Many developed countries have already achieved a high recovery rate, but some developing countries are still struggling with the large amount of construction and demolition waste. Among construction and demolition waste, mixed waste is one of the most difficult wastes to recycle because it is composed of various materials such as steel, wood, fabric and ceramics.

The European Union set a target recovery rate of 70% by 2020. However, the available data includes not only reuse and recycling, but also backfilling, which is a low-grade use of inert materials just to fill holes in excavated areas. Recently, a 70% recycling rate (excluding backfilling) was suggested as a target for 2030. Actions to increase recycling other than the low-grade backfilling should be promoted by policymakers.

Recycled biowaste per capita

In a circular economy, biomass resources must be returned to the economy or the natural environment in a beneficial way, and biowaste from households is particularly important as it is more often landfilled.

In a circular economy, biomass resources must be returned to the economy or the natural environment in a beneficial way. Among biowaste, that of households is particularly important as it is often landfilled, while industrial biowaste is recycled on a relatively large scale. This indicator measures the progress in recycling (composting and methane fermentation) of biodegradable municipal waste, such as garden and park waste and food waste.

This indicator steadily increased from 53 kilograms (kg) per capita in 2000 to 97 kg per capita in 2020 in the European Union (EU). The EU is heading in the right direction, but progress in other regions is unknown due to the lack of publicly available data.

Recycling rate of packaging waste

Packaging is a constantly growing source of waste in the world, so the recycling of these products is crucial to a circular economy. However, data on the recycling of these products is limited.

Packaging is a constantly growing source of waste in the world. For example, the total amount of packaging waste in the European Union (EU) has increased by more than 20% over the last 10 years and is projected to increase by another 19% by 2030. On average, each European generates 179 kilograms (kg) of packaging waste annually. In addition, packaging tends to be single use and accompanied by the purchase of products in it.

Recycling policies on packaging waste have been implemented since the 1990s. Unfortunately, packaging recycling data tends to be for specific packaging materials or items such as PET bottles, and it is therefore hard to assess the entire situation. The EU and U.S. are good examples of jurisdictions that publish data on packaging recycling rates covering a variety of materials.

The recycling rate of packaging waste in the EU was 55% in 2005 and reached 68% in 2016, but then started to decline and was back to 64% in 2020, moving away from the EU target of 70% in 2030. In the U.S., the recycling rate increased from 41% in 2005 to 54% in 2018; however, 37% still ended up in landfills. The progress in the other regions is unknown in a comparable way. Factors affecting the recycling rate of different countries/regions include source separation of packaging waste at home and in the office, producers' involvement in responsibility schemes, and the existence of local collection schemes and their coverage of packaging items.

More efforts and enabling conditions are necessary, including, for example, motivation raising and incentives for sorting packaging waste. It is also important to promote collection that is efficient and convenient and ensure effective recycling that is supported by product design for higher recyclability. A proper financial scheme on recycling fees and a differentiated recycling fee system according to product recyclability, as well as stakeholder collaboration, can also make actions more effective.

Recycling rate of municipal waste

The recycling of municipal waste, which includes household waste, increased gradually from 24% in 2000 to 35% in 2020 in OECD countries, but is still well below the European Union policy target of 60% by 2030.

The recycling of municipal waste, which includes household waste, is a typical indicator that has been used by many countries for a long time. It increased gradually from 24% in 2000 to 35% in 2020 in Organisation for Economic Co-operation and Development (OECD) countries. However, the European Union adopted a policy target of 60% by 2030. For all OECD countries to achieve 60%, the annual improvement of recycling municipal waste would need to be accelerated by a factor of more than 10 compared to the trajectory from 2016 to 2020. 

Recycling rate of industrial waste

Information on the recycling of industrial waste is important to advance recycling activities at the end of use, but there is no centralized or publicly available data.

Industrial waste is the waste produced by industrial processes. This includes almost all waste outside of municipal waste. Examples are sludge from wastewater treatment facilities, slags from metal refinery processes and various wastes from manufacturing processes. Information on the recycling rate of industrial waste is also important to advance recycling activities at the end of use. However, there is no centralized or publicly available data source. Harmonization of categories of industrial waste is also key to compare the progress of countries in recycling and identify best practices.

Recycling rate of total waste generated

Tracking the global recycling rate is important because it shows the share of wastes that are recycled and diverted from waste disposal, but recycling rates for specific waste streams do not give a holistic view on recycled waste.

Tracking the global recycling rate is important because it shows the share of wastes that are recycled and diverted from waste disposal. Historically, “recycling rates” were used for specific waste streams, such as municipal waste, packaging, electronics and automobiles. However, such specific recycling rates do not give a holistic view on recycling and don't reveal how much total waste is truly being recycled. Therefore, the recycling rate of total waste, which includes all types of waste, including both municipal waste and industrial waste, has drawn recent attention.

The recycling rate of total waste increased in the European Union (EU) from 53% in 2010 to 58% in 2020Several non-EU countries also have such data, with the rates in 2019 ranging from 10% in Colombia to 59% in Australia. Many countries have made notable efforts on recycling, but even a leading region like the EU is still not recycling more than 40% of materials in waste, although approximately half of the non-recycled waste is recovered for energy. Acceleration of actions is expected and will be important.

To make the economy circular, these non-recycled wastes should be recycled or avoided from the beginning. Governments, industries and citizens need to look at detailed situations of each waste stream and relevant consumption patterns. Setting an internationally agreed upon target is also an important task for the global community.

Enablers and barriers

We also monitor change by tracking a critical set of 5 factors factor that can impede or help spur progress toward targets. Explore the data and learn about key actions supporting systems change.

Number of extended producer responsibility schemes

Engagement of both an upstream entity, such as producer and retailer, and a downstream entity, such as collector and recycler, is very important to connect material cycles and advance effective product design for recycling.

Effective material circulation cannot be established unless multiple stakeholders — ranging from collectors to recyclers and users of recycled materials — are engaged in collaboration. Specifically, engagement of both an upstream entity, such as producer and retailer, and a downstream entity, such as collector and recycler, is very important to connect material cycles and advance effective product design for recycling. This indicator counts the number of extended producer responsibility (EPR) schemes as such collaborative schemes for effective reuse and recycling.

No recent centralized global data source has been identified, although about 400 EPR systems were in operation around 2015. Updating the information and promoting such collaboration should be prioritized. (This is already occurring in some countries, like the U.S., where the Product Stewardship Institute is updating national data). France is a good example of increasing the number of product groups targeted by EPR schemes and collecting and publishing the latest data on recycling implementation. 

Number of countries with deposit-refund and pay-as-you-throw schemes

Deposit-refund and pay-as-you-throw schemes can improve the sorting of recyclables, increasing the amount of recycling and making the process easier.

Sorting recyclables from waste is beneficial not only for increasing the amount of recycling, but also for keeping recyclables clean and unmixed with other materials and thereby making recycling easier. Monetary incentives are important to improve people's sorting behavior. Such monetary incentives include giving subsidies or rewards and introducing deposit-refund schemes. These incentives urge people to bring in recyclables to stores and other collection points. Pay-as-you-throw schemes, which charge people according to the amount of waste, give both disincentives for people to discard recyclables in waste and incentives to promote better sorting of recyclables.

This indicator measures the number of countries that introduce deposit-refund schemes and pay-as-you-throw schemes. Other sorting incentive schemes exist, including recycling promotion schemes that provide a subsidy or reward, but we focus on these two types because they don’t require an extra budget and are therefore more sustainable.

No recent centralized global data source has been identified, although older data showed that more than 60 deposit-refund schemes existed in the world as of 2010.

Total number of design-for-recycling requirements (EU only)

Product design with sufficient recyclability — such as fewer joints to disassemble, marks indicating the positions of joints, the use of a single material and the restriction of the use of toxic substances — is an essential condition for recycling.

Product design with sufficient recyclability — such as fewer joints to disassemble, marks indicating the positions of joints, the use of a single material and the restriction of the use of toxic substances — is an essential condition for recycling. This indicator counts the number of regulations across the world that require products to achieve specific recyclability. A single country could have multiple design-for-recycling requirements; therefore, indicator values can exceed the number of countries in the world. The EU Eco-design directive is an example of such regulation. A study showed an increasing trend of the number of requirements related to recyclability in the EU since 2010.

Amount of wastes containing hazardous substances

Hazardous substances can make recycling more difficult and create environmental pollution, so removal of these substances through reducing and replacing them in products or separating them from recycling at the end-of-use stage is key to improving recycling.

If collected materials contain hazardous substances, it is more difficult to recycle them. Environmental pollution occurs when contaminated recycled materials are used outside, and when used in products that will contact foods or that are used indoors, these recycled materials harm human health. Removal of hazardous substances from recyclables is therefore necessary. Reducing and replacing the use of hazardous substances as well as separating them from recyclables at end of use can reduce the harms from these materials. Separation is important between hazardous wastes and other wastes, but also between hazardous substances or components and the other components of certain waste products. Giving an incentive for separating these hazardous substances is also important in recycling policy.

Due to the current limitation of data availability, we have only collected the data of separation between hazardous waste and other wastes, and this data does not include recent data. Monitoring efforts should be increased and the categories of hazardous substances agreed upon globally. 

Percent of waste sorted and collected for recycling

The first step to recycle and recover resources from waste is to sort recyclables by materials or proper categories, but there is no comprehensive data to measure sorted waste.

The first step to recycle and recover resources from waste is to sort recyclables by materials or proper categories. One possible measurement of sorted waste is to survey consumers’ behaviors or intentions, such as the percentage of the given population sorting waste or willing to sort. Another measurement is to directly measure the amount of sorted recyclables considering the different degree of sorting difficulty. However, neither of these measurements have been surveyed in a continuous, comparable way across countries.

Data Challenges

Plenty of data about recycling exists, but it is patchy and fragmented. Each country has its own issues and policy interests related to waste management and tends to focus on subcategories of waste without looking at the entire situation (for example, glass and PET bottles instead of total packaging waste and total waste generated). Thus, the scope of recycling of municipal waste, packaging waste, e-waste, etc., differs by country. Some countries have not yet even started recycling certain types of waste. There is also some disagreement on what to count as recycling. The inclusion or exclusion of a subtype of waste or a type of recycling method can greatly impact recycling data from a country. In addition, some countries monitor the collection rate of waste products to recycling facilities, while others monitor the amount of recycled materials divided by the amount of collected waste products to recycling facilities. Neither of these indicates the overall recycling situation of the waste product properly. Thus, comparison of the situation and performance of recycling between countries is difficult, and reasonable, comparable data is lacking.