Governments use economic policies to meet national development goals, and fiscal policies in particular are critical to address climate change, protect biodiversity and promote equity. Governments can better tax environmental harms and invest in the green economy.

Governments have a variety of economic policy instruments at their disposal to meet national development goals and manage the economy. These include fiscal, monetary, trade, welfare, labor and industrial policies. There is now a diversity of ideas for how to better incorporate climate, nature and equity into economic policy. This comes alongside a broader rethink of how governments can advance innovation and industrial policy, shift labor market policies to promote green jobs and promote new concepts of economic growth and prosperity in policymaking.

Governments have already begun to apply new economic thinking to fiscal policy. For example: 31 countries have implemented carbon tax policies; an estimated 78 countries have 1,340 environmentally-beneficial subsidies and payments in place; and policies like the European Union’s (EU) Cohesion Policy, which established funds to help less developed countries catch up in terms of decarbonization, environmental protection and development.
 

International institutions driving economic policy reform

Several international institutions that influence economic policy — like the International Monetary Fund (IMF), the EU Commission, the International Finance Corporation and the Organisation for Economic Co-operation and Development (OECD) — are also prompting policymakers to rethink fiscal policy in order to better address climate change, protect biodiversity and improve equity.

Governments are using fiscal policy tools, and gradually other economic policies, to steer markets toward strategic green industries and sectors in a “new era” of industrial policy.
 

Three key areas for fiscal policy reform

Fiscal policies can better support climate, nature and equity in three key areas: ending and repurposing harmful subsidies, pricing greenhouse gas (GHG) emissions and other environmental harms, and investing in innovation, growth and jobs. Systems Change Lab will revisit other policy areas in the future as global convergence on targeted economic policies is formed.
 

Ending harmful subsidies to support sustainability

Rather than taxing unsustainable activities, governments continue to subsidize the development of new fossil fuel reserves, overfishing, mining, land-degrading agricultural practices and harmful fisheries practices. Government subsidies provide non-market benefits through direct funding, preferential tax treatment, non-commercial loans or guarantees, or preferential pricing schemes. Each year, an estimated total $1.7 trillion in government subsidies is committed toward fossil fuels and harmful agricultural, fisheries and land use practices. These financial flows must be phased out and redirected to support a sustainable, decarbonized economy.
 

Implementing carbon pricing and market-based mechanisms

Setting prices on GHG emissions and harmful activities makes pollution-intensive activities more expensive, incentivizing pollution reduction or the development of lower-emission technologies. To internalize externalities, governments can “price” environmental impacts by imposing direct taxes on harmful activities or using market-based mechanisms such as emissions trading schemes to manage pollution.
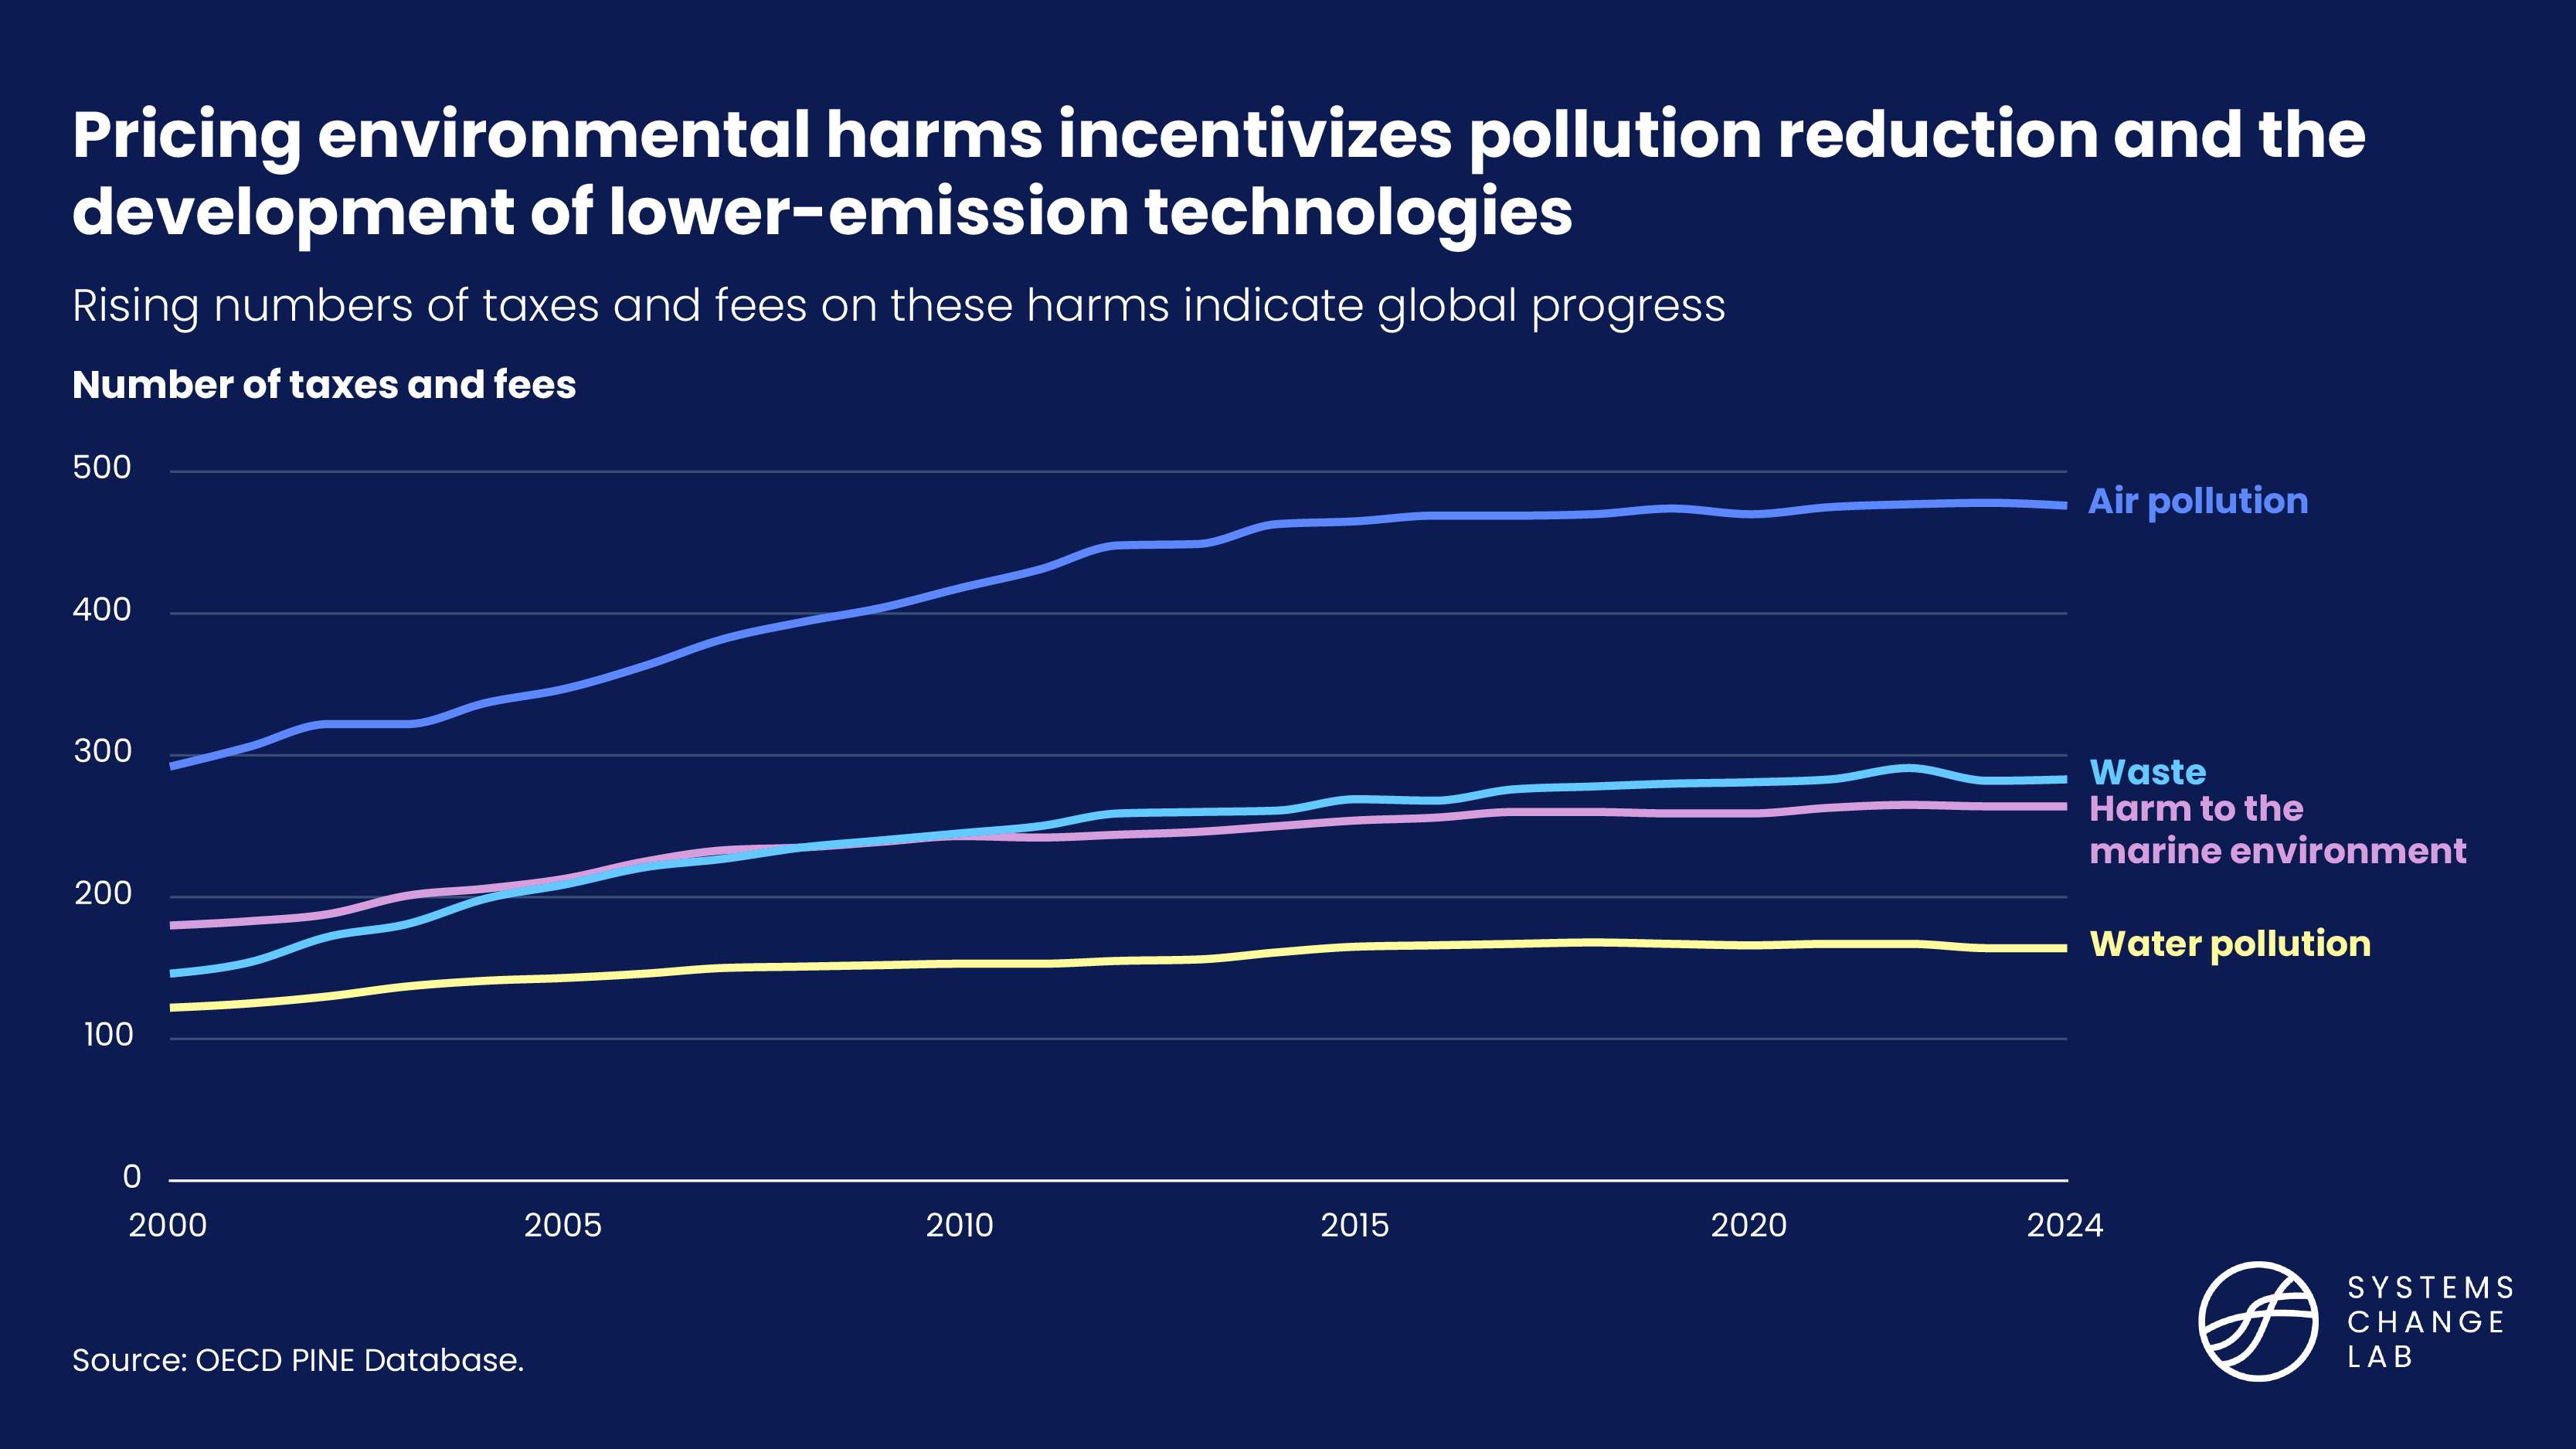
Number of taxes and fees on enviornmental harms

Governments also use implicit prices that change the relative cost of sustainable and unsustainable activities through measures like fuel and energy taxes. Prices can reflect GHG emissions’ impacts on society (referred to as the social cost of carbon), or they can target an amount to incentivize the economy to meet specific GHG targets.
 

Scaling public finance for innovation, green jobs and climate action

Revenues generated by pricing and tax mechanisms, repurposed public subsidies or expansionary fiscal policy measures can significantly scale the amount of public finance that supports innovation, growth of decarbonization technologies, green jobs, marginalized communities and environmentally-beneficial activities. Governments are also typically the biggest consumer of goods and services in any economy, and can use this procurement power to rapidly scale decarbonization technologies.

Estimates suggest that global public investment in climate measures should increase to at least $3.8 trillion a year by 2030, drawing from both domestic and international sources. Finance to developing countries also needs to increase to meet the recent global commitment of $300 billion a year and work toward $1.3 trillion. Experts further suggest tripling public investments in nature-based solutions and increasing financial resources for biodiversity to at least $439 billion per year by 2030.
Tracking progress on global outcomes

2874: Public fossil fuel finance

Status: Wrong Direction
Historical Data Methodology and Challenges:

Total numbers were calculated by summing production and consumption subsidies, capital expenditures and financing for projects from multilateral development banks, export credit agencies and development finance institutions for each year. The 2023 figure for financing for projects was estimated by averaging the values from the three previous years.

Target Methodology:

The IEA’s net-zero roadmap to achieve 1.5 degrees C found that, beyond projects already committed to in 2021, no new investment in new fossil fuel supply is required to meet global energy needs. This finding was echoed by the IPCC’s Sixth Assessment Report.

Both the G20 and G7 have made long-standing commitments to phase out “inefficient fossil fuel subsidies,” with the former stating in 2009 that it would do so “over the medium term,” and the latter in 2016 setting a deadline for doing so by 2025. At COP26, Parties to the UNFCCC likewise called for the “phase-out of inefficient fossil fuel subsidies,” which they reiterated in the Global Stocktake outcome decision at COP28. The year 2030 will be 21 years after the G20 commitment was made, stretching the limit of the definition of “medium term.”

In addition, at COP26 in 2021, 34 countries and five financial institutions committed to ending international public finance for unabated fossil fuels by the end of 2022. Therefore, our target is for public finance for fossil fuels to be phased out globally by 2030, with G7 countries and international financial institutions achieving this by 2025, in line with their commitments.

Public finance, whether on concessional or commercial terms, plays a critical role in propping up fossil fuel industries, especially coal. It materializes via production and consumption subsidies, financing from development finance institutions and export credit agencies, and capital expenditures and project financing from state-owned enterprises. It is estimated that 93% of coal power plants are well insulated from market forces and benefit from public support through long-term supply contracts, tariffs and other means.

In order to meet Paris Agreement goals, public funders need to act swiftly to remove public concessionary support for fossil fuels, eliminate finance for coal power generation and phase out oil and gas investment. Public policy should redirect investment and job growth toward clean energy and support the economic transition for affected communities. Although leaders of the G20 countries, comprising the world’s 20 largest economies, pledged to stop public financing for new coal power plants overseas by 2021, no commitment was made to stop using coal domestically. And the G7 countries have not been able to agree on fully ending public finance for fossil fuel energy.

In 2023, public finance for fossil fuels fell 26% from the previous year, driven by reduction in consumption subsidies in line with falling international oil and gas prices. However, it was still higher than historical averages and totaled about $1.5 trillion, with $1.1 trillion directed to subsidies, $47 billion to financing of projects and $369 billion to capital expenditures. As a result, progress toward phasing out public finance of fossil fuels globally by 2030 was moving in the wrong direction as of 2023. It will need to fall by an average of $215 billion per year between 2023 and 2030 to meet the 2030 phase-out target.

2875: Harmful fisheries subsidies

Status: Insufficient Data
Historical Data Methodology and Challenges:

Collected data from a report by Sumaila et al. (2019) by filtering for the “capacity-enhancing” category. There is not enough historical record to track the progress of this indicator.

Target Methodology:

One of the UN Sustainable Development Goals (SDGs), SDG Target 14.6, aimed to prohibit harmful fisheries subsidies by 2020. In 2022, the World Trade Organization reached an agreement to ban certain harmful fisheries subsidies. While the agreement is still in the process of being approved, we carry over the previous 2020 target to 2025.

Harmful fisheries subsidies include any monetary or in-kind government support to the fishing industry that contributes to overfishing or illegal, unreported and unregulated fishing.

The intent of these subsidies is to supplement income or lower costs for fishing operations, but they can have significant negative impacts on fish stocks. Additional payments can allow fleets to fish more at greater distances and for longer amounts of time. Harmful fisheries subsidies contribute to overcapacity — more labor, and more and better equipment than the fisheries can support — which further exacerbates fishing beyond sustainable limits.

According to the Food and Agriculture Organization (FAO), about 34% of the world’s fish stocks are fished beyond their biological limits. Harmful fisheries subsidies were estimated to total around $22.2 billion globally in 2018, with China, the European Union, Japan, Russia, South Korea, Thailand and the United States together providing more than two-thirds of these subsidies.

The Pew Charitable Trusts estimates that if all harmful subsidies were eliminated, fish biomass could increase by at least 12.5% globally by mid-century. One of the targets under the United Nations Sustainable Development Goals (SDGs) aimed to prohibit these subsidies by 2020, but gaining agreement by World Trade Organization (WTO) members has been challenging. In June 2022, WTO members reached a milestone agreement to curb harmful fisheries subsidies; as of 2024, they were in the process of formally ratifying the agreement, with some members concerned that the envisaged rule will not be strict enough to encourage reform from the largest subsidizers.

Harmful fisheries subsidies should have been phased out by 2025, but the world is not on track to meet this goal. These subsidies would have needed to fall by an average of about $3 billion per year since 2018 to have met a 2025 phase-out target. Updated data is needed to determine the current levels of harmful fisheries subsidies and track progress.

2876: Agricultural subsidies incentivizing unsustainable intensification and overuse of natural resources

Status: Insufficient Data
Historical Data Methodology and Challenges:

Data is for total negative agricultural subsidies from the United Nations Environment Programme’s State of Finance for Nature report (2023).

Target Methodology:

According to “A Multi-Billion-Dollar Opportunity: Repurposing agricultural support to transform food systems,” the reduction and redirection of harmful agricultural subsidies is essential for the world to meet the UN Sustainable Development Goals by 2030. Harmful subsidies need to be phased out and, most importantly, that support repurposed to enable sustainable agricultural production.

Governments provide agricultural support in many ways, but one of the main ways is through subsidies. Agricultural subsidies are designed to create incentives for specific practices or types of production, lower price risk and uncertainty, and benefit local farmers. They can take the form of lower costs for consumption, guaranteed market prices, trade barriers and direct government spending to support production and farmer income. Some subsidies target production inputs (e.g., fertilizers, pesticides, fuel and irrigation) and intensify their use.

However, if not designed properly, subsidies can lead to distortion in the markets, unsustainable land management, overproduction, and soil and water pollution.

According to the Food and Agriculture Organization, current agricultural support is unequally distributed across farm types and sizes and is largely harmful for the environment and human health. The reduction and redirection of harmful agricultural subsidies is essential for the world to meet the Sustainable Development Goals by 2030.

Pricing support to maintain or raise market prices and payments based on output levels and unconstrained input use are typically the most market-distorting and environmentally harmful. Agricultural subsidies should be structured to reduce environmental harm and encourage sustainable and/or regenerative production practices that mitigate carbon dioxide emissions and maintain healthy soils and waters.

Some countries have already shifted support toward sustainable practices by decoupling payments from production and reducing input subsidies, thereby discouraging inefficient production and excessive use of fertilizers and pesticides. Another approach that seems to be effective is structuring farm payments to be contingent on environmental goals.

According to the State of Finance for Nature report, harmful agricultural subsidies reached $345 billion in 2022. Different studies estimate that only 5% of agricultural support is dedicated to conservation, while 87% is considered “price-distorting or harmful to nature and health.” Although simply removing support can bring adverse effects (such as impact on diets, higher food costs and undernourishment), agricultural support should be repurposed to do less environmental harm and support healthier, equitable and sustainable measures.

Harmful subsidies need to be phased out and agricultural support repurposed to enable sustainable agricultural production by 2030. This indicator will be updated once more precise data on unsustainable agricultural subsidies is identified and made available.

2897: GHG emissions covered by direct carbon pricing consistent with 1.5° C pathway

Status: Insufficient Data
Historical Data Methodology and Challenges:

Data was collected for countries with carbon pricing systems with a price greater than $220/tCO2e. Currently, no countries have a carbon price at that level. For the purposes of this indicator, we reference the minimum threshold of $170/tCO2e (in 2015 USD) to align with a 1.5 degrees C pathway; this approach will be refined as analysis improves. The IPCC price range required to meet a 1.5 degrees C pathway is estimated to be $170-$290/tCO2e by 2030 and about $430-990/tCO2e by 2050.

According to the latest Intergovernmental Panel on Climate Change (IPCC) report, greenhouse gas (GHG) emissions should be priced at least $170 per tonne of carbon dioxide equivalent (tCO2e) by 2030 and $430/tCO2e by 2050 in order to limit warming to 1.5 degrees C (2.7 degrees F) and avoid the most significant impacts of climate change. This can be done either by direct pricing or through other policies that create an implicit price.

In 2024, the World Bank estimated that direct carbon pricing schemes — emissions trading systems, carbon taxes and carbon crediting — covered about 24% of global GHG emissions. However, none of the direct pricing schemes were priced at levels consistent with a 1.5 degrees C pathway.

To meet 2030 and 2050 targets, a higher percentage of global GHG emissions needs to be covered by some form of carbon price, whether direct or indirect. Given their outsized share of responsibility for historical emissions, developed countries must play a leading role in the implementation of direct carbon pricing schemes.

2898: GHG emissions covered by direct carbon pricing

Status: Well Off Track
Historical Data Methodology and Challenges:

This data is for GHG emissions covered by any carbon pricing system, in share of global GHG emissions. These values were calculated by summing up the percentage of GHG emissions covered by carbon prices implemented in each year (accounting for overlapping emissions between instruments).

Target Methodology:

The target is designed so that all GHG emissions are covered by at least some level of carbon pricing, even if prices are below the minimum levels consistent with a 1.5 degrees C pathway.

Directly pricing all greenhouse gas (GHG) emissions is an important policy tool to reduce emissions and protect the climate. It is an economically efficient mechanism that allows market forces to direct efforts to least-cost mitigation options first. Even if prices are often not adequately high to reduce the scale and pace of emissions enough to limit warming to 1.5 degrees C (2.7 degrees F), they can still help limit emissions.

As with any policy, the efficacy and practicality of carbon pricing will vary across geographies and sectors. However, expanding carbon pricing regimes can enhance their economic efficiency benefits. It can also prevent emissions from migrating from jurisdictions where emissions are priced to places where they are not (known as carbon leakage).

According to the World Bank, as of 2024, only about 24% of global GHG emissions were covered by a direct carbon pricing regime. By 2030, all GHG emissions should be covered by at least some level of carbon pricing, even at levels below the minimum range consistent with a 1.5 degrees C pathway. To reach this target, coverage will need to grow about 13 percentage points per year, more than five times the historical rate.

2899: Weighted average direct carbon price

Status: Well Off Track
Historical Data Methodology and Challenges:

Data was calculated by taking the weighted average of prices based on the percent of global greenhouse gas (GHG) emissions covered by each carbon price for each year, according to the World Bank. The share of global GHG emissions covered accounts for the overlap between instruments. In cases where instruments have multiple price levels, only the main rate is used for calculations.

Target Methodology:

These targets were derived from the interquartile range of carbon prices in 2030, 2035 and 2050 across a filtered set of 24 scenarios that limit warming to 1.5 degrees C (2.7 degrees F) with no or limited overshoot from integrated assessment models examined in the IPCC’s Sixth Assessment Report. These scenarios do not transgress key environmental and social safeguards and incorporate equity considerations by ensuring GHG emission declines are steeper in developed countries than in developing countries. The derived carbon prices were then adjusted to ensure that the units of the target match in scope the units of the most recent year of data available, 2024 US dollars.

Integrated assessment models often use carbon prices as a proxy for regulatory effort. While carbon pricing is an important tool, it is insufficient on its own to meet climate targets, requiring complementary policies such as subsidies and standards, which can also reduce the carbon prices needed to drive decarbonization. The weighted average is calculated based on the percentage of global GHG emissions covered by each carbon price for each year.

Under existing direct carbon pricing regimes — emissions trading systems, carbon taxes and carbon crediting — the global weighted-average carbon price was about $19 per tonne of carbon dioxide equivalent (tCO2e) in 2024. However, models examined in the Intergovernmental Panel on Climate Change’s (IPCC) Sixth Assessment Report estimate much higher global carbon prices required to limit warming to 1.5 degrees C (2.7 degrees F): at least $240/tCO2 by 2030 (approximately a twelvefold increase of the global average) and at least $580/tCO2 by 2050 (nearly a 28-fold increase).

This means that the average price for carbon will need to increase by roughly $45 per year between 2024 and 2030 to reach the target, an acceleration of more than 30 times the historic rate.

These targets will not be met by direct carbon pricing alone. They will be reached by a combination of direct pricing and complementary policies that implicitly price carbon by incentivizing a transition from high-carbon activities to low-carbon activities. Such complementary policies, like subsidies and standards, can also reduce the carbon prices needed to drive decarbonization. Nevertheless, the direct prices underscore the enormous gap between current measures  and the incentives and regulatory efforts needed to reach the 1.5 degrees C goal.

2900: Environmental tax revenue

Status: Wrong Direction
Historical Data Methodology and Challenges:

The global value covers OECD member countries and 99 non-OECD countries and areas. On the OECD platform, we filtered data based on: measure (tax revenue, million USD), category of environmentally-related tax revenue (all tax bases), domain of environmentally-related tax revenue (total environment) and unit (US dollar).

The production and consumption of goods and services often create waste and/or pollution, harming ecosystem and human health.

When these environmental harms are not reflected in the cost of goods and services, producers and consumers shift the costs of their harmful activities to society at large. These socialized costs are often referred to as “externalities.” Externalities create inefficient use of resources from an economic perspective. More importantly, their damage is often inequitable, disproportionately impacting vulnerable communities.

According to Principles for Responsible Investment and the UN Environment Programme Finance Initiative, global environmental externalities resulting from air pollution, natural resource use and waste are expected to reach $7.8 trillion annually by 2050. Governments can intervene and reduce negative externalities by implementing environmental taxes on activities that generate such external damages. Taxes help internalize environmental costs.

Data from the Organisation for Economic Co-Operation and Development (OECD) indicates that environmentally related taxes amounted to $608 billion globally in 2023. As environmental tax regimes expand and enforcement improves, revenue from these regimes should increase. Then, as they encourage behavior to shift away from harmful activities, revenue should eventually decline.

2901: Capital investment in the low-carbon energy system

Status: Well Off Track
Historical Data Methodology and Challenges:
  • The total values were calculated by adding renewables, battery storage, electricity networks and end-use.
  • “Grids and storage” annual values were calculated by adding battery storage and electricity networks.
  • “Other low-carbon energy” annual values were calculated by subtracting “renewable power,” “grids and storage,” and “energy efficiency and end-use” from the total amount of clean energy.
Target Methodology:

According to IEA’s Net Zero by 2050 scenario, investments in low-carbon, clean energy need to scale up to about $4.6 trillion by 2030.

The public sector regulates and incentivizes private economic activity, but it also makes capital investments directly. Governments, public financial institutions and state-owned enterprises make investment decisions to create or maintain physical fixed assets like public buildings, infrastructure and vehicle fleets. These assets can produce greenhouse gas (GHG) emissions directly, demand energy or other emissions-intensive inputs, or enable the emissions of other economic actors.

Combined, private sector capital investment and public sector decisions to invest in capital or incentivize private capital formation are the pivotal financial decisions driving the GHG emissions or decarbonization of the energy system. To decarbonize the economy, the public sector will need to replace capital investments that create and maintain high-carbon assets — or produce emitting products — with low-carbon alternatives.

The good news is that capital investment in the low-carbon economy has begun to take off. The International Energy Agency (IEA) estimated $2.2 trillion of capital investment in 2025 in the low-carbon economy, comprising clean power and fuels, batteries, electric vehicles, carbon capture and storage, grids, energy efficiency, and greening buildings. According to the IEA’s Net Zero by 2050 scenario, however, clean energy capital investment will need to grow three times faster and reach about $4.6 trillion by 2030 in order to replace the high-carbon economy and meet society’s growing demands.

2902: Public climate finance

Status: Well Off Track
Historical Data Methodology and Challenges:

Data was compiled from successive editions of the Global Landscape of Climate Finance report series. Data from 2011-2016 was sourced from the 2022 edition, 2017 from the 2023 edition, and 2018-2023 from the 2025 edition. Due to a methodology change in the latest 2025 report, values from 2011-2017 are not comparable to values in 2018-2023.

Target Methodology:

To limit temperature rise to 1.5 degrees C (2.7 degrees F) and build climate-resilient societies, estimates suggest that $6.9 to $11 trillion of climate finance per year will be required by 2030 and $6.8 to 12 trillion by 2035, sustained through 2050.

It is difficult to determine the precise breakdown between public and private finance needed to meet climate goals, given that such a disaggregation depends on the social and political choices made by societies, institutions and governments about the ideal mix of market and state intervention in economies. The Independent High-Level Expert Group (IHLEG) on Climate Finance, an independent group launched by the COP26 and COP27 Presidencies to provide policy recommendations to scale up public and private investments for climate action, estimated the public and private finance necessary to meet climate mitigation, adaptation, loss and damage, just transition and nature investment goals in emerging markets and developing countries (excluding China) by 2030, with 55% coming from public sources and 45% from private. The group found that most finance is needed for the clean energy transition, natural capital, and adaptation, largely in line with the categories of needs identified in the sources and scenarios analyzed by the Climate Policy Initiative.

While the IHLEG estimates are limited to the context of developing countries, they can serve as a useful proxy for global estimates in the absence of more comprehensive public and private climate finance targets at the global level. The distribution broadly aligns with historical global climate finance flows from 2012 to 2022, with public and private climate finance being about equally balanced. We estimate that 55% of global climate finance needs will come from public sources and 45% from private sources to derive targets for global public climate finance and global private climate finance.

The composition of climate finance flows is likely to change, as seen in the private share rising to 66% in 2023, and the reasonable expectation that private finance will play a larger role in advanced economies and in mitigation efforts over adaptation, especially for commercially mature solutions. The public-private mix may be revised in the future to reflect new estimates and improvements in tracking climate finance flows. This indicator includes both domestic and international flows.

Using IHLEG estimates as a reference, we assume “other concessional finance” to be public given that concessional finance has often originated from public sources and the nonconventional sources of funding contemplated like the international taxation of high-emitting sectors and issuance of the International Monetary Fund’s special drawing rights. Other sources of finance classified as public are public finance, multilateral development banks, bilateral finance and South-South cooperation.

Scaling up public climate finance is necessary to ensure a rapid transition to a decarbonized, resilient world. It plays a vital role, especially in areas where private finance is insufficient, unwilling or ill-suited to meet climate objectives at the speed and scale necessary. This includes, for instance, public services and infrastructure (such as transportation and energy networks); research, development, demonstration and some commercialization of new low-carbon technologies; and ecosystem protection. Public climate finance can also be deployed to ensure equitable outcomes and a just transition. Public climate finance is delivered through different channels and actors, most notably development financial institutions (DFIs) — national and multilateral — and state-owned financial institutions.

It is difficult to determine the precise ideal breakdown between public and private finance needed to meet climate goals, given that such a disaggregation depends on the social and political choices made by societies, institutions and governments about the ideal mix of market and state intervention in economies. Historical data from 2012 to 2022 shows a roughly equal split between public and private climate finance, with some estimates suggesting that 55% of climate finance necessary to meet climate, nature and just transition goals in developing countries (excluding China) will need to come from public sources.

In 2023, public climate finance flows amounted to around $650 billion, a 13% percent drop from 2022, due to large scale fiscal contractions among the world’s governments, and with further declines possible given that several developed countries recently reduced their foreign aid budgets. This decline needs to be reversed.

Public climate finance will need to accelerate more than six times the current trajectory to reach the estimated $3.8 to $5.9 trillion per year target for 2030. Reaching the $4.9 trillion per year midpoint of the target range will require an average increase in investment of about $600 billion per year between 2023 and 2030.

2903: Public finance for nature-based solutions

Status: Insufficient Data
Historical Data Methodology and Challenges:

Public finance numbers were sourced exclusively from the State of Finance for Nature 2026 report and includes those from Domestic Government and Public Overseas Development Assistance (ODA). The total public finance figures displayed on the platform are the sum of the annual public finance figures shown in Fig. 8 of the State of Finance for Nature 2026.

Target Methodology:

According to the State of Finance for Nature 2026, to keep 1.5 degrees C within reach, protect biodiversity and promote equity, public and private investments in nature-based solutions must almost triple between 2023 and 2030 and increase fourfold by 2050, reaching $571 billion per year by 2030 and $771 billion per year by 2050. The public targets were updated by applying the public share of the targets from the State of Finance for Nature 2023 report to the updated 2026 total targets.

Nature-based solutions are actions that restore, preserve or manage ecosystems to address climate change and protect nature. These actions, such as protecting coral reefs and mangrove restoration, can help reduce greenhouse gas (GHG) emissions, boost ecosystem health and address environmental issues like soil erosion, biodiversity loss and deforestation.

About $220 billion was directed toward nature-based solutions in 2023, with public finance contributing $197 billion of this total. However, this level of investment isn’t enough to reach our climate goals. Estimates suggest that total investments in nature-based solutions need to almost triple by 2030 and increase fourfold by 2050 to $571 and $771 billion per year, respectively. For the public sector, this means investing $462 billion per year by 2030 and $516 billion per year by 2050.

At the same time, investing in nature offers the opportunity to generate $10 trillion in business value and create 395 million jobs.

2909: Climate finance flows to developing countries

Status: Off Track
Target Methodology:

We measure the total amount of climate finance (public and private) destined for developing countries against the current $300 billion per year commitment that was pledged at COP29 in 2024.

Developing countries contribute the least to climate change but are most vulnerable to its impacts. Most of these countries are not resourced or prepared for these climate impacts and will continue to suffer loss and damage, with costs estimated at $447 to $894 billion in 2030 in developing countries alone. In addition, they often lack the resources needed to invest in and gain the benefits of a low-carbon, greener economy. Developed countries must increase public climate finance to help developing countries overcome these inequities.

In 2022, developed countries provided about $115.9 billion in climate finance to developing countries, with $91.6 billion from public sources, $21.9 billion from mobilized private sources and $2.4 billion from export credits.

Out of that $115.9 billion total, 60% was for mitigation, 28% for adaptation and 12% for cross-cutting purposes. The share of funding dedicated to adaptation is still falling short of the 50-50 split that some experts have proposed.

This 2022 total $115.9 billion marked the first time climate finance to developing countries reached above the original $100 billion annual target agreed to at COP15 in 2009. However, this only begins to make up for the shortfall created by developed countries’ late achievement of the target.

A new climate finance goal was agreed upon at COP29 in 2024, calling for developed countries to deliver at least $300 billion annually and move toward $1.3 trillion by 2035. Despite tripling the earlier goal, this amount does not meet the needs and priorities of developing countries. Negotiations for “loss and damage” funding for residual damages — the economic costs that cannot be prevented through adaptation — are also ongoing, with initial commitments to the Fund for Responding to Loss and Damage far too low compared to the scale of climate-related disasters.

Once data becomes available, a breakdown of donor countries and recipients will reveal which countries are meeting their pledges and which have not received the funding they need.

2904: Finance for biodiversity

Status: Insufficient Data
Historical Data Methodology and Challenges:

Public biodiversity finance amount, the lower-end value of international public biodiversity finance amount ($3.9-9.3 billion per year), and lower-end value of private biodiversity finance ($6.6-13.6 billion per year) were sourced from the OECD’s “Comprehensive Overview of Global Biodiversity Finance” report. 

Target Methodology:

According to the Kunming-Montreal Global Biodiversity Framework adopted in 2022, financing from all sources toward biodiversity preservation and protection needs to reach $200 billion per year by 2030.

Major funding is needed to halt biodiversity loss and preserve wildlife and natural habitats. The Kunming-Montreal Global Biodiversity Framework adopted in 2022 identified the need to increase financial resources to at least $200 billion per year by 2030, and suggested increasing international financial flows to developing countries by at least $30 billion per year from public and private sources. These resources will be instrumental in achieving a range of biodiversity protection goals, including the 30x30 target, which aims to conserve 30% of the world’s land, waters and seas by 2030.

The devastating loss that the extinction crisis could bring to the global economy and society is incalculable, particularly for Indigenous communities who depend on biodiversity and are at the forefront of its protection. Business sectors that directly rely on biodiversity will also experience losses in profitability and risk their long-term survival unless biodiversity is protected.

For example, $235 to $577 billion in annual global food production is dependent upon the contribution of animal pollinators, and coral reefs generate $36 billion in ecotourism every year. Protecting biodiversity is also closely linked to improving human health, as many medicines are derived from nature. The loss of biodiversity could therefore also endanger future discoveries of new medical treatments.

Finance can protect biodiversity using different instruments, from direct government expenditures and incentives for environmentally sustainable practices to philanthropic and private investments in nature-based solutions.

Leveraging public finance will be essential, yet recent trends fall short. Between 2015 and 2017, global biodiversity finance totaled $78.3 billion annually, with public sources providing at least $71.7 billion per year and private sources contributing at least $6.6 billion. Total biodiversity finance will need to nearly triple to reach $200 billion by 2030, and will need to grow at an average rate of $10 billion per year between 2017 and 2030 to meet that goal.

2905: Jobs in renewable energy

Status: Right Direction
Target Methodology:

Though this indicator does not have a specific global target identified, an increase in data over the past five years indicates that this indicator is headed in the right direction.

A just transition will be one with abundant, quality employment in the net-zero, sustainable economy, whether those jobs are specifically in new green sectors or in other parts of the economy.

High-quality green employment should offer fair wages, robust worker protections and promote social equity by encouraging inclusivity across diverse workforces. The benefits of broad employment can be widely distributed and reach a broad spectrum of job beneficiaries, including underserved and marginalized groups. By providing stable and well-paying work, quality green jobs can play an important role in reducing poverty, narrowing wealth inequality and fostering a more equitable and sustainable economy.

While there is no regular, reliable dataset on high-quality green employment across the economy, jobs in renewable energy can serve as a useful proxy for tracking employment growth linked to the net-zero transition.

Global employment in renewable energy was estimated at 16.2 million in 2023, up from 7.3 million in 2012 when it was first measured. Of the approximately 16 million jobs, the four largest employment sub-sectors within the renewable energy industry are solar photovoltaic (44%), bioenergy (24%), hydropower (14%) and wind energy (9%).

2906: Climate finance flowing to underserved and marginalized communities

Status: Insufficient Data

Data on whether investments in climate and nature are benefiting underserved and marginalized communities is essential to making such investments more equitable. This indicator will be updated as the subnational distribution of climate finance is better tracked.

Key enablers and barriers to change

2877: Fossil fuel subsidies

Historical Data Methodology and Challenges:

Country-level data was filtered by beneficiary (consumer) and mechanism (induced transfer).

According to the Intergovernmental Panel on Climate Change (IPCC), removing fossil fuel subsidies could lower global emissions between 1% and 10% by 2030 while also reducing government spending.

The phasing out of state subsidies for fossil fuels is necessary to ensure that the production and consumption of fossil fuels is subject to market competition and that the true costs are reflected in prices. Fully reflecting the costs of fossil fuels also entails pricing their harmful emissions.

Studies of fossil fuel consumption subsidies across many countries have shown that they are regressive: the richest households capture most of the benefits. Nonetheless, eliminating some subsidies can raise energy costs in ways that do impact lower-income groups. Rebates and financial support can help relieve the burdens created by changes in energy costs when subsidies are withdrawn. These support mechanisms can be funded by the revenue generated from removal of fossil fuel subsidies.

The Fossil Fuel Subsidy Tracker estimates that global fossil fuel subsidies reached around $921 billion in 2024: $403 billion was directed to petroleum, $260 billion to natural gas, $216 billion to end-use electricity and about $41 billion to coal. While fossil fuel subsidies have declined since their 2022 peak of $1.7 trillion, 2024 subsidy values are still a 17% increase from 2021 and a 60% increase from 2010. The dramatic increase in 2022 was largely due to major economies subsidizing fossil fuels in response to the sharp increase in energy prices caused by Russia’s invasion of Ukraine.

G20 countries have reiterated commitments to phase out “inefficient fossil fuel subsidies” since 2009, and in 2016 the G7 announced a goal to phase them out by 2025, which was not met. During the UNFCCC COP28 in Dubai, countries approved a roadmap to “transition away” from fossil fuels. Yet, these commitments have not translated into reductions at the scale needed to meet the phase-out targets, and few countries referenced fossil fuel subsidies in their latest nationally determined contributions. Fossil fuel subsidies need to be phased out globally by 2030 to meet climate targets.

2914: Fishing subsidies reallocated toward sustainable fishing practices, as measured by subsidies to management of fishing resources, stock enhancement programs, and research and developments

The global fishing industry is a major recipient of government subsidies, but mismanagement of marine resources has placed food systems and ocean ecosystems in jeopardy. Today, an estimated total $35 billion of government spending or subsidies supports fishing; 63%, or $22.2 billion, of that is considered harmful, contributing to overfishing and depletion of fisheries.

Harmful fishing subsidies often provide international fishing corporations and local coastal communities with incentives to overfish, often via illegal, unreported and unregulated practices. This then contributes to the depletion and collapse of fisheries. Harmful fishing subsidies need to be phased out and shifted to more sustainable practices and to supporting local fishing communities.

According to the Food and Agriculture Organization, “the fraction of fish stocks that are within biologically sustainable levels decreased from 90% in 1974 to 65.8% in 2017.” Governments can redirect fishing subsidies and protect these valuable marine resources through a range of actions. They can establish catch shares to allocate fishing rights, appoint marine commissions to act as regulatory bodies and conduct ecosystem risk assessments, and develop certifications to establish environmental standards for fishing companies.

The phaseout of harmful subsidies and reallocation of support toward sustainable practices is critical to ensure food security, protect marine biodiversity and safeguard the fishing industry. According to the Organisation for Economic Co-operation and Development (OECD), government subsidies targeted to management of fishing resources, stock enhancement programs and research and development totaled $2.9 billion in 2020, which equates to 13% of harmful fishing subsidies globally. Only a small percentage of this, an estimated $107 million in 2020, is earmarked for supporting fishing communities.

2878: Countries with biodiversity-relevant subsidies

Historical Data Methodology and Challenges:

Data was collected by selecting “Biodiversity” as the domain and “Environmentally Beneficial Subsidies and Payments” as the instrument type. 

The Organisation for Economic Co-operation and Development (OECD) tracks four main types of economic instruments related to biodiversity that can mobilize finance and generate revenue: biodiversity-relevant subsidies, biodiversity-relevant taxes, fees and charges, and tradable permits.

Biodiversity-relevant subsidies channel public finance toward sustainable forest management, reforestation and land conservation and sustainable agricultural practices. As of 2025, 50 countries had biodiversity-relevant subsidies, rising slowly from 30 in 2000.

The post-2020 global biodiversity framework identified the need to increase biodiversity finance to at least $200 billion per year by 2030, including $10 billion to developing countries per year.

2879: Government support for agricultural research, education and technical assistance

Historical Data Methodology and Challenges:

OECD data on “Producer Support Estimates (PSE)” and “General Services Support Estimates (GSSE)” was reorganized into the categories from the World Bank report Revising Public Agricultural Support to Mitigate Climate Change (Searchinger et al. 2020) to determine what amount of agricultural subsidies went toward "research and technical assistance" outcomes. 

The amount of agricultural subsidies that support research and technical assistance was calculated by adding the total spending for “research, education and technical assistance.”

Agriculture is a major beneficiary of government subsidies and a primary driver of land degradation and soil and water pollution. The United Nations Environment Program (UNEP) estimates that harmful agricultural subsidies totaled $345 billion in 2022. Subsidies to support agricultural producers are projected to triple to $1.8 trillion by 2030.

Rather than continue business-as-usual practices that exacerbate the overuse of natural resources and catalyze biodiversity loss and pollution, government spending can be re-oriented to research, development and implementation of sustainable agricultural innovations. Improvements in productivity would no longer depend on toxic pesticides and resource exploitation, but on improved farming techniques and technologies. Higher proportions of such government funding will have many spillover benefits, such as increasing crop yields, avoiding land-use changes and reducing greenhouse gas (GHG) emissions.

According to the International Food Policy Research Institute (IFPRI), global spending from public, nonprofit and higher education sources toward agricultural research amounted to $46.8 billion in 2016, a 51% increase from 2000. Other studies estimate about $60 billion of annual funding on agricultural research and innovation for emerging and developing countries between 2010 and 2019, with 60%-70% coming from public sources. However, less than 7% of the total funding targeted sustainable agricultural innovation.

In 2021, according to the Organisation for Economic Co-operation and Development (OECD), governments alone allocated $34.8 billion to agricultural research, education and technical assistance. This was in line with historical averages and corresponded to about 8% of total direct government agricultural spending. These amounts aren’t exclusively for sustainable agricultural research, so it’s likely that some of the support is being directed to harmful technologies and practices. The indicator will track support to sustainable agricultural research once the breakdown becomes available.

2884: Countries covered by emissions trading systems and carbon taxes

Historical Data Methodology and Challenges:

Data was collected by filtering the World Bank Carbon Pricing Dashboard by status (implemented), type of instrument (ETS/Carbon tax) and jurisdiction (national/subnational/regional).  The yearly data does not include instruments that were implemented, but later abolished.

When multiple carbon pricing instruments exist within a country, the year of the first implemented instrument is used. Each country is only counted once in global total for each year, even if it has both ETS and carbon tax instruments. As a result, the global total is smaller than the sum of countries covered by ETS and countries covered by carbon tax due to overlap.

Two of the most common ways to implement a direct carbon pricing regime are via emissions trading systems (ETSs) and carbon taxes.

ETSs, also referred to as cap-and-trade, limit total emissions by issuing tradable emissions allowances, which emitting firms can buy or sell. A cap-and-trade program establishes a carbon price by limiting the total quantity of emissions and letting a firm’s willingness to pay create the carbon price (unlike carbon taxes, through which the government sets the price). The cap and availability of allowances can be lowered over time to further incentivize emissions reduction.

ETS programs are thus different from carbon taxes because they guarantee a certain level of emissions reductions, rather than a certain price. Both carbon taxes and ETSs can be effective in reducing emissions if designed and implemented well. As of 2024, 52 countries were covered by a carbon tax or an ETS. Of these, 31 countries had a carbon tax and 41 had an ETS.

2885: Market value of carbon trading via emissions trading systems

Historical Data Methodology and Challenges:

Values prior to 2021 were sourced from page 1 of Refinitiv Carbon Markets Year in Review report, converted from EUR to USD using exchange rate from the U.S. Treasury (conversion value as of 02/12/2024). The 2022 and 2023 data were sourced from the media coverage of the LSEG Carbon Market Year in Review 2023.

Greater participation in carbon trading via emissions trading systems (ETSs) can support greater greenhouse gas (GHG) emissions reductions. When an ETS is established, the total emissions cap is set and allowances are allocated to participants in the market. Participants trade permits from firms that can reduce emissions cheaply to firms whose emissions reductions are expensive.

Carbon prices under ETSs still trade below the minimum prices prescribed for a 1.5 degrees C (2.7 degrees F) pathway. However, thanks to relatively stable traded volumes and increasing prices, the total market value for carbon trading reached $949 billion in 2023. According to the London Stock Exchange Group (LSEG), this was a 2% increase from the previous year.

The European Union maintains the world’s largest ETS by traded value, where prices hit over 100 euros for the first time in 2023 but fell later that year due to lower demand from buyers operating in the industrial and power sectors. Prices also surged to their highest levels in major North American carbon markets in 2023, reaching $39 per ton in the Western Climate Initiative.

According to LSEG, expectations that emissions caps will get stricter from renewed climate pledges by governments have led to higher demand for allowances, thereby increasing prices. Further policy commitments should drive prices and trade higher.

2886: Revenue recycling from direct carbon pricing schemes recycled for environmental and equity goals

Historical Data Methodology and Challenges:

Data was sourced from I4CE’s annual Global Carbon Account reports under “Carbon pricing: use of revenues” (in million USD). Data was filtered to include three categories: specific earmarking, tax exemptions and direct transfers.

Implementing a direct carbon price that is regressive can impact low-income households disproportionately and impose unfair burdens with higher living costs. For example, increased fuel prices as a result of carbon pricing could harshly impact poor communities when energy constitutes a large portion of their overall spending.

Revenue raised via carbon pricing can be recycled and allocated toward policies that create positive societal and environmental outcomes, offsetting some of the uneven distributional impacts of carbon pricing. It can also be used to mitigate climate change and reduce reliance on fossil fuels, such as earmarking funds for green infrastructure or a climate investment fund.

There is evidence of public support for revenue recycling to fund infrastructure, renewable technologies, low-income programs and tax rebates. Recycling revenues to reduce corporate taxes and fiscal deficits, however, is very unpopular. To increase the likelihood that a carbon price will be both equitable and politically enduring, governments need to set revenue recycling schemes that ameliorate the costs for impacted communities and tackle climate change.

The Institute for Climate Economics analyzed 34 countries and subnational regions with carbon revenue recycling programs in 2022. Combined, the programs recycled about $64 billion toward tax exemptions (such as tax credits and tax cuts), direct transfers (including distributions to households) and earmarks for green or development projects (for example, infrastructure and climate funds). More detailed breakdowns of how carbon revenue is being used for environmental and equity purposes will be included once data is available.

2887: Environmentally-related tax instruments and fees on air pollution

Historical Data Methodology and Challenges:

Data was collected by filtering the PINE database by environmental domain (air pollution) and category name, selecting only "tax" and "fee."

Atmospheric air pollutants, including sulfur, methane and nitrogen oxides, are major drivers of rain and soil acidification, respiratory diseases, heart disease and stroke. Since 1979, international agreements such as the Convention on Long-Range Transboundary Air Pollution have created binding emissions-reduction commitments.

In order to penalize polluting industries and promote the adoption of low-emission processes, governments have implemented taxes on air pollutants. Examples include charges on vehicle exhaust, motor fuels and heating from fossil fuels.

As these kinds of taxes and fees expand globally, national governments can price pollution properly and shift industries toward clean energy. Air pollution taxes can also serve as gateways to carbon pricing.

According to the Organisation for Economic Co-operation and Development (OECD), in 2025, there were a total of 519 environmentally-related taxes and fees on air pollution.

2888: Environmentally-related tax instruments and fees on harm to the marine environment

Historical Data Methodology and Challenges:

Data was collected by filtering the PINE database by environmental domain (ocean) and category name, selecting only "tax" and "fee.”

From ocean acidification to overfishing, the health of our ocean is in rapid decline. It can be restored through the sustainable management of fisheries, tourism and development, and a reduction in pollution and plastic debris.

Financial instruments such as taxes can be implemented to internalize the environmental costs of harm to the marine environment. To preserve marine ecosystems, countries have adopted taxes and fees on wastewater, harmful fishing practices and maritime transportation, and added protections for endangered species.

Data from the Organisation for Economic Co-operation and Development (OECD) indicates that in 2024, there were a total of 264 environmentally-related taxes and fees related to the ocean. These align incentives and can also generate revenue for marine restoration projects.

2889: Environmentally-related tax instruments and fees on waste

Historical Data Methodology and Challenges:

Data was collected by filtering the PINE database by environmental domain (solid waste) and category name, selecting only "tax" and "fee."

Effective waste management is critical to address the environmental and public health consequences of waste degradation, which often disproportionately affects under-resourced communities.

Globally, 2.56 billion tonnes of solid waste were generated in 2022, nearly surpassing the World Bank estimate of 2.59 billion tonnes of solid waste generated by 2030. In areas of growing urbanization, annual waste generation may reach 3.85 billion tonnes by 2050. Landfills emit an estimated 11% of global methane emissions, a greenhouse gas that absorbs about 80 times as much heat as carbon dioxide over 20 years.

Solid waste management taxes and charges internalize the negative environmental externalities associated with trash generation and capture its social cost. They can increase the cost of landfill dumping and disincentivize consumption of non-biodegradable products.

By charging industries for solid waste production, governments encourage polluters to adopt more circular business models. At the same time, consumers become more conscious of the importance of reducing waste.

According to the Organisation for Economic Co-operation and Development (OECD), in 2024, there were a total of 293 environmentally-related taxes and fees on solid waste management.

2890: Environmentally-related tax instruments and fees on water pollution

Historical Data Methodology and Challenges:

Data was collected by filtering the PINE database by environmental domain (water pollution) and category name, selecting only "taxes and fees."

Water pollution is a major global issue. It degrades vital freshwater resources, harms aquatic ecosystems and wildlife and affects human health. Industries discharge millions of tons of toxic wastes and heavy metals every year, and according to the Food and Agriculture Organization, 80% of municipal wastewater is discharged into water bodies untreated.

Wastewater taxes and fees combat water pollution. They can raise the costs for firms that dump water pollutants and heavy metals into sewage treatment plants, thereby incentivizing industries to meet water quality standards and reduce wastewater disposal.

According to the Organisation for Economic Co-operation and Development (OECD), in 2025, there were a total of 182 environmentally-related taxes and fees on water pollution. The more countries adopt water pollution taxes, the more likely it is that oceans and freshwater will remain clean and productive.

2891: Countries with biodiversity-relevant taxes, fees, tradable permits and offsets

Historical Data Methodology and Challenges:

Data was collected by filtering the PINE database by environmental domain (biodiversity) and instruments, selecting only active "taxes and fees" and "tradable permits and offsets."

The Kunming-Montreal Global Biodiversity Framework identified the need to increase biodiversity finance by at least $200 billion per year by 2030, including increasing total biodiversity-related international financial resources to developing countries by $20 billion per year by 2025 and $30 billion per year by 2030. Two studies focused on closing the biodiversity and nature-based solutions financing gap have estimated this need to be much higher, ranging from $598 to $824 billion annually to reverse the biodiversity crisis by 2030, and $571 billion annually by 2030 for nature-based solutions that support biodiversity. Governments can ensure that financial resources move toward biodiversity protection by eliminating harmful subsidies and developing incentives for conservation and protecting biodiversity.

The Organisation for Economic Co-operation and Development (OECD) tracks two main types of economic instruments related to biodiversity that can generate revenue: biodiversity-relevant taxes and fees, and tradable permits and offsets.

Biodiversity-relevant taxes — which include taxes on pesticides, fertilizers, forest products and timber harvests — impose a cost to use natural resources to compensate for the related harms caused. An increase in these types of taxes should incentivize more sustainable behaviors and practices.

Biodiversity-relevant fees and charges can range from hunting license fees to charges on sewage discharge. Such fees discourage the overuse or abuse of public resources that could damage biodiversity.

As of 2025, there were a total of 457 biodiversity-relevant taxes and fees in 85 countries, a 55% increase since 2000.

Biodiversity-relevant tradable permits include tradable quotas for fisheries, tradable hunting rights and tradable development rights. Such permits can restrict the use of natural resources while providing individual licenses to users that can be traded. If permits are auctioned, they can raise additional revenues that can be earmarked for biodiversity goals. However, biodiversity permits must be designed with care because they are not easily fungible. In 2025, there were a total of 51 biodiversity-relevant tradable permits schemes in 30 countries.

2892: Countries with national-level taxes and charges on single-use plastics and plastic bags

Historical Data Methodology and Challenges:

Data was compiled by adding all countries listed in the UNEP report “Legal Limits on Single-Use Plastics and Microplastics” in Table 14 (“Countries which have a tax on manufacture/ production/import of plastic bags”), Table 15 (“Countries which charge a levy or fee for plastic bags at the national level on the consumer”) and Table 25 (“Types of taxation on single-use plastics”).

From packaging to water bottles, plastic is ubiquitous in our lives — but its convenience has come at the expense of our natural environment and human health.

The United Nations Environment Programme (UNEP) estimates that as many as five trillion plastic bags are used globally every year, adding to the 400 million tonnes of plastic waste produced annually. A significant portion of plastic waste is dedicated to food packaging: about one million plastic bottles are bought every minute. Out of the seven billion tonnes of plastic waste generated so far, less than 10% has been recycled. As a result of plastic waste mismanagement, 9 to 14 million tonnes of plastic enter the ocean every year. Plastic pollution eventually impacts local water sources, food safety and public health.

In order to combat plastic pollution, governments have imposed charges on single-use plastics (bottles, straws, cups, cutlery, etc.) and other plastic products, including microplastics. Taxes on plastic polymers will increase costs, and thereby aim to shift consumer demand away from single-use products and motivate companies to invest in sustainable alternatives. Examples of substitutes include compostable plastics or durable materials such as metal or glass.

According to UNEP, as of 2018, 59 countries had taxes and charges on single-use plastics or plastic bags.

2893: Public investments in low-carbon energy research, development and demonstration

Historical Data Methodology and Challenges:

Drawing from IEA data, values for regions were summed to get global numbers. The global total energy RD&D budget was then multiplied by the global share of low-carbon each year to calculate the budget for low-carbon RD&D.

Governments play a crucial role in catalyzing the technological innovation needed to drive an environmentally sustainable and decarbonized economy. Historically, governments have had a strong track record of supporting important stages of technological innovation. Early stages of innovation, from research through technology commercialization, benefit immensely from government support — without it, many technologies would be left undiscovered or meet insurmountable investment challenges before making it to the market. This is particularly true for low-carbon energy technologies, where highly impactful innovations are capital-intensive and require long time horizons.

According to the International Energy Agency (IEA), in 2023 global public spending on research, development and demonstration (RD&D) for low-carbon energy innovation grew by about 2% to reach $38.2 billion. It represents about 77% of total public energy RD&D spending.

Some examples of low-carbon and zero-emission technologies still requiring early-stage innovation are green building materials, long-duration electricity storage and zero-emission industrial heat. Public investments in later stages of the innovation cycle that bring technologies to commercial readiness are less well tracked.

One study estimated public investment in commercialization to have reached about $6 billion in 2020. With the recent expansion of green industrial policies in the United States and the European Union, this amount has probably increased considerably. Commercialization data will be included as it becomes available.

2894: Countries with green public procurement practices in their procurement strategies and regulations

Historical Data Methodology and Challenges:

The list of countries with green public procurement practices was provided by report authors. 

Green public procurement involves making the government’s process of sourcing and purchasing materials and supplies more sustainable and aligned with climate and environmental goals.

Government procurement from countries in the Organisation for Economic Co-operation and Development (OECD) makes up, on average, about 30% of government expenditures and about 13% to 20% of gross domestic product (GDP), making governments the single biggest purchaser of goods and services in a country. Public procurement also drives innovation and progress in sectors such as transportation, waste management, construction, industrial products, defense and security, and utilities. Governments can use their massive purchasing power to shift markets and production toward sustainable technologies and resource-efficient economies.

Countries adopting green public procurement practices will create new demands and market incentives, which will encourage the private sector to develop and scale sustainable innovations. A study by the World Economic Forum estimates that greening public procurement could boost the green economy by $4 trillion and create about 3 million new jobs.

As of 2021, 79 countries had adopted green public procurement practices, including provisions in their procurement laws and environmental criteria for procurement categories.

2895: Blended finance supportive of the Sustainable Development Goals in developing countries

Historical Data Methodology and Challenges:

The category “Other” is calculated as the difference between “Total” blended finance and “Climate” blended finance.  

The public sector can catalyze private investment by assuming risks that the private sector may be unwilling to take in any given sector, technology, geography or market. If the investments are successful, the private sector becomes more likely to continue to invest.

The public sector can also mobilize private capital through concessional finance, where the development finance institution accepts below-market returns because of the public benefit of the project. Philanthropy and impact investors can further catalyze private investment and are often willing to bear more risk than the public sector, albeit with fewer total resources than those available to governments.

Increased public, philanthropic and impact investment can generate more private capital in climate solutions and sustainable development, especially in developing and emerging markets and technologies. According to Convergence, blended finance flows to achieve the Sustainable Development Goals in developing countries totaled $15 billion in 2023, while climate blended finance reached $11.6 billion. This shows an increase by about 71% and 107%, respectively, as compared to 2022 totals, driven by improvements in macroeconomic conditions affecting developing countries, including easing inflationary pressures and the resilience of local currencies.

2896: Public support for increased public investments in the green economy

Historical Data Methodology and Challenges:

Data only includes G20 countries.

G20 countries have the responsibility — and the resources — to reform their economies through green jobs, businesses and investments. Political leaders, especially in democratic governments, are more likely to increase public spending on green investments if there is strong, organized popular demand from the general public.

Polling that indicates positive popular sentiment can be a leading indicator for greater public green investments to transition toward a green economy. Public support for public green investments will be tracked when corresponding data is identified and made available.

In the meantime, the polling from the United Nations Development Programme’s Peoples’ Climate Vote, the largest public opinion survey on climate change, can be used as a proxy. In 2021, it found that 12 of the G20 countries had majority support for increased investments in green businesses and jobs. The United Kingdom boasted a 73% approval rate, while Australia, Canada and Germany all registered 68% approval rates.

Other shift Other shifts needed to transform the system

Integrate new prosperity metrics into economic planning and policymaking

Economic growth, measured primarily by GDP, has long been a central goal of economic planning and policymaking. While GDP growth has supported positive trends such as poverty reduction, it has been accompanied by societal costs like climate change, environmental degradation and increasing inequality.

Embed climate, nature and equity into economic analysis

Policies aimed at climate, nature and equity have major implications for traditional economic goals, and vice versa. However, the economic analysis toolkit used to understand the economy and evaluate policies is only beginning to incorporate them.