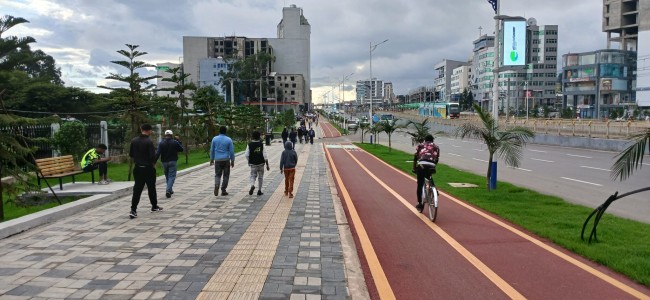
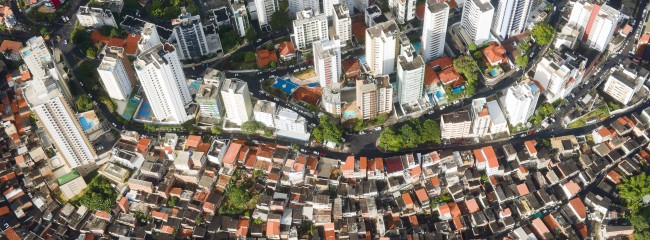
Photo by Jordan Opel via Unsplash

One in three city dwellers live in slums and lack reliable, safe or affordable access to basic urban services and infrastructure. Persistent inequities in access to urban services disproportionately burden poor and marginalized communities, contribute to poverty and increase exposure to climate risks.

The world’s urban population is expected to increase by 2.5 billion people by 2050, by which point roughly two-thirds of the global population is expected to live in urban areas. Much of this urban growth will occur in low-lying coastal zones and locations vulnerable to severe flooding and extreme heat risks.

Already, one in three city dwellers — over 1.2 billion people — do not have reliable, safe or affordable access to basic everyday services and infrastructure like running water and sanitation, electricity, decent housing and transport to work and school.

This inequality of access, known as the “urban services divide,” creates significant challenges and burdens for vulnerable communities, including additional time and money that must be spent to meet basic needs. This necessarily affects community members’ productivity, health and opportunities. It is estimated that by 2050, more than 216 million climate migrants will relocate to cities within their country, flocking mainly to vulnerable informal settlements that lack access to basic services.

Inequality and climate action should not be separated, because improving access to basic urban services can simultaneously address the compounded challenges of rapid urbanization, the urban services divide and vulnerability to climate risk.

All key urban services systems and sectors — from land and housing to transport, energy, water and sanitation — are critical for achieving equitable urban climate adaptation and mitigation solutions, alongside city development. In order to be climate resilient, cities must focus on closing the urban service divide.

Several Sustainable Development Goals (SDGs) and indicators, including those within SDGs 6, 7 and 11, aim to greatly increase access to electricity, clean cooking fuels, water, sanitation and public transport by 2030. The indicators in this shift show that the world is currently off track for achieving access to basic services for all urban dwellers by the end of the decade.

Tracking progress on global outcomes

1704: Urban population with safe and convenient access to public transport and infrastructure

Status: Insufficient Data
Historical Data Methodology and Challenges:

Data was collected from the annual UN Sustainable Development Goal (SDG) reports. The 2018 data is sourced from the SDG 2019 report, based on data from 227 cities. The 2019 data is sourced from the SDG 2021 report, based on data from 610 cities. The 2020 data is sourced from the SDG 2022 report, based on data from 1,510 cities.

This indicator is shared with the transport system.

Target Methodology:

Sustainable Development Goal (SDG) 11.2 sets a target to provide access to safe, affordable, accessible and sustainable transport systems for all and improve road safety, notably by expanding public transport by 2030. To be aligned with SDG 11, a target of 100% access to public transport by 2030 was chosen.

Progress Assessment Methodology:

There is insufficient historical data (only 3 years of data) to calculate the current trend or assess the status of this indicator.

As of 2020, only 51.6% of the world’s urban population had convenient access to public transport. In Sub-Saharan Africa and Central and Southern Asia, only 31% and 34% of the population, respectively, had convenient access to transport in urban areas.

Because transport emissions account for 15% of global greenhouse gas (GHG) emissions, improving access to public transport will not only improve livelihoods and equity outcomes, but also mitigate climate change by reducing emissions. Additionally, access to high quality transport can reduce road fatalities, as cities with higher public transit use have lower traffic fatality rates.

This indicator measures access to public transport as the share of the population within 500 meters walking distance of low-capacity transport systems (buses and trams) and 1,000 meters distance to high-capacity systems (trains, subways and ferries).

The data for this indicator used only public transport stops that are mapped, which may include both formal and informal public transport stops. Many cities in developing countries have informal transport systems that are not mapped and therefore are not included in this dataset.

1876: Urban population without access to safely managed sanitation

Status: Well Off Track
Historical Data Methodology and Challenges:

Data was calculated by subtracting percent of urban population with access to safely managed sanitation from 100%.

Target Methodology:

This target is aligned with Sustainable Development Goal (SDG) 6. Because this indicator looks at population without access while SDG 6 looks at population with access, the target for this indicator is 0% by 2030, as opposed to the SDG of 100% by 2030.

According to the World Health Organization, as of 2022, 35.2% of the world's urban population did not have access to safely managed sanitation services. This has been declining since 2000, when just over 50% of the world’s urban population lacked access.

Safely managed sanitation is defined as improved facilities that are not shared with other households and where excreta are safely disposed of or treated off-site. According to UNICEF, improved facilities include “flush/pour flush toilets connected to piped sewer systems, septic tanks or pit latrines; pit latrines with slabs (including ventilated pit latrines); and composting toilets.”

Inadequate access to sanitation can negatively affect public health, impose high costs on households and degrade the natural environment. Sanitation improvements can prevent diseases and premature deaths, reduce costs and save time for households. Because of this, every dollar invested in sanitation improvements is estimated to generate economic returns between $5.50 and $9.00.

Sustainable Development Goal 6 aims to ensure access to water and sanitation for all by 2030. To reach this target by 2030, progress in urban areas needs to accelerate 10 times faster.

1705: Rapid transit coverage in cities

Status: Well Off Track

Buses and trains are a crucial component of decarbonizing the transport sector. They release about a quarter as much emissions per passenger-kilometer (pkm) as ride-hailing services and about half as much as private vehicles.

This indicator measures the number of kilometers (km) of rapid transit per million people. Across the world’s 50 highest-emitting cities, rapid transit coverage increased from 16 km per million people in 2010 to 24 km in 2024. To achieve a pathway compliant with the 1.5 degrees C (2.7 degrees F) target, rapid transit in these 50 cities would need to reach 38 km per million people by 2030. This would require the pace of change achieved over the last five years to increase by 5 times.

Rapid transit — comprising metro, light rail and bus rapid transit (BRT) — represents the primary modes of sustainable mass transit in cities around the world. Globally, metro systems grew steadily between 2010 and 2023. Seventy-three urban conglomerates opened their first metro systems during this period, with China accounting for half of these launches. Between 2010 and 2022, China inaugurated a new metro line in at least one urban area every year. By 2025, India’s metro network exceeded 1,000 km across 23 cities, ranking third globally behind China and the United States.

As of 2025, BRT networks served 191 cities globally, carrying over 32 million passengers daily, with Latin America leading at 19 million daily passengers over 2,000 km of corridors. However, after two decades of rapid growth, BRT implementation has slowed in recent years.

It is important that cities provide broader support to public transport systems, including rapid transit and bus services. Policies that address informal popular transport systems, such as minibuses, are also needed.

1702: Bike lane coverage in the world's 50 highest-emitting cities

Status: Well Off Track
Historical Data Methodology and Challenges:

Data was calculated by selecting the top 50 emitting cities from "Carbon Footprints of 13,000 Cities" and using OpenStreetMap to calculate the number of high-quality (Level of Traffic Stress 1 or 2) kilometers of cycling infrastructure for each year and each city from 2010 to today. Population estimates from the United Nation's 2018 Revision of World Urbanization Prospects was also used in the calculation to calculate the indicator per 1,000,000 inhabitants.

This indicator is shared with the transport system.

Target Methodology:

We followed the target identified by Moser and Wagner (2021) of 2 km of high-quality infrastructure per 1,000 inhabitants (2000 km per 1 million inhabitants) by 2030, which is aligned with a 1.5 degrees C carbon budget. This metric is derived from "Health Impact Assessment of Cycling Network Expansions in European Cities", which looked at the relationship between modal share of cycling and availability of high-quality cycling infrastructure. As we did to calculate the rapid-transit-to-resident ratio, we selected the top 50 emitting cities from "Carbon Footprints of 13,000 Cities" and used Open Street Maps to calculate the number of high-quality (Level of Traffic Stress 1 or 2) kilometers of cycling infrastructure for each year and each city from 2010 to today using "Carbon Footprints of 13,000 Cities". Our method filtered for tags that indicated lower stress, high-quality bike lanes within the overall bike network, defined as any street or passageway where biking is permitted. This included discrete bike paths and trails, cycle tracks, and buffered cycle lanes. This kind of filtering did not count some street types that might be low-stress for cyclists but which are not explicitly designed for their use, such as low-volume and/or low-speed residential streets or multi-use paths without dedicated space for cyclists. The result was aggregated at the city level, thereby identifying the total kilometers of protected, low-stress segments within the city boundaries.

It is important to note here that not all cities around the world are well mapped in OpenStreetMap, especially when it comes to bike lanes in earlier years of the dataset. Therefore, in some cities, the coverage of bike lanes in the data may be driven more by how active volunteers have been in mapping their cities rather than the true length of bike lanes in those cities.

Progress Assessment Methodology:

Data was only available in 5-year increments, not annually, so instead of using a linear trendline for the past 5 years, we calculated the “current trend” arrow by drawing a straight line between the most recent data point and the data point from five years prior, therefore using just two moments in time. See our methodology page and the State of Climate Action 2023 for more information on our approach for assessing progress. 

Access to high-quality bike lanes is key because it can foster a shift to a near-zero-carbon form of transport and improve the safety and health of residents, particularly those that do not own or cannot use private motorized vehicles. In a recent study of European cities, cyclists had 84% lower carbon dioxide (CO2) emissions per person from all daily travel than non-cyclists.

If 10% of the urban population were to switch from driving to cycling, transportation emissions from cities would be expected to decrease by about 10%. Supporting better infrastructure for cycling is an opportunity for policymakers to address climate change and improve public health, by reducing injuries and potentially increasing ridership.

In 2020, there were approximately 4.4 kilometers (km) of segregated bike lanes per million people in the top 50 emitting cities. This is an increase from 0.075 km/1 million people in 2010. The data is based on bike lanes mapped in OpenStreetMap, so some of this increase may be driven by how active volunteers have been in mapping their cities rather than the true length of bike lanes in those cities.

In order to be on a 1.5 degrees C (2.7 degrees F) pathway, this number needs to increase to 2000 km/1 million inhabitants by 2030. Progress will need to accelerate more than tenfold to meet this goal. Of course, building infrastructure will not guarantee that people will use it, but it is a necessary condition — alongside other incentives for mode shift — to allow for better cycling access.

Bike use surged during the COVID-19 pandemic, when public transport systems were used much less than usual, and countries and cities have an opportunity to capitalize on that spike in interest in the post-pandemic era. European countries like Denmark, Germany and the Netherlands are already world leaders in creating safe, convenient and accessible cycling conditions.

Cities looking to expand cycling infrastructure can also follow the example of Seville, Spain, where the local government expanded cycling infrastructure from 12 km of unconnected cycle paths in 2005 to 120 km of protected bike lanes in 2010. The expansion was coupled with a bike-sharing system, which helped boost the number of daily bike trips fivefold over three years.

Bogotá, Colombia, expanded bicycle infrastructure by an impressive 33% (from 443 km to 590 km) between 2015 and 2021. Bogotá’s 2020-24 Strategic Plan includes the goal to further expand bicycle infrastructure to 830 km by 2024, alongside growing the number of cycle trips by 50%.

Cities like Paris are similarly setting bold goals for cyclability. Its goals include making it possible to bike every street in the city and prioritizing pedestrians and cyclists over cars in the flow of traffic.

1703: Premature deaths from fine particulate matter (PM 2.5)

Status: Wrong Direction
Historical Data Methodology and Challenges:

Data was collected by selecting “Ambient particulate matter pollution” under “Health Impact” on the State of Global Air website. 

This indicator is shared with the power system.

Air pollution is the world’s leading environmental health risk factor. In 2019, about 7% of all deaths worldwide were attributable to exposure to fine inhalable particles, which is defined as particulate matter with a diameter of less than 2.5 micrometers (PM2.5). Nearly half of all exposure from fine particles is caused by unsustainable energy practices, including the combustion of fossil fuels.

Rapidly urbanizing countries in Africa and Asia have the highest levels of air pollution. This is caused by several factors, including lack of access to clean fuels for cooking and emissions from transportation and manufacturing industries. Nearly everyone in rapidly urbanizing low- and middle-income countries is currently exposed to PM2.5 levels that exceed the guidelines from the World Health Organization (WHO). Children, residents of low-income areas and Black, Indigenous, Hispanic, Asian and other communities of color are disproportionately impacted.

Sustainable Development Goal 7 aims to phase out biomass combustion for heating and cooking by 2030. If achieved, this would result in a 20% reduction in premature deaths from PM2.5 exposure as compared to 2015 levels (4.6 million), reducing the total to about 3.7 million.

Meeting three interrelated goals — the phasing out of internal combustion engines, thermal power generation (without pollution controls) and other fossil fuel combustion by 2050 — would translate to a 50% reduction in premature deaths from PM2.5 exposure as compared to 2015 levels, further reducing the total to about 1.9 million (author’s analysis). Thus, achieving reductions of 20% by 2030 and 50% by 2050 would help save millions of lives.

Unfortunately, this indicator is headed in the wrong direction, as evidenced by the continued increase in premature deaths from 1990 until 2021  resulting from air pollution. In 2020, there was a drop in premature deaths from 4.6 million in 2019 to 4.43 in 2020, likely as a result of the COVID-19 pandemic. However, in 2021, premature deaths increased again to 4.72 million. Premature deaths from PM2.5 exposure must peak immediately and fall quickly to meet the 2030 goal.

1671: Access to clean cooking in urban areas

Status: Well Off Track
Historical Data Methodology and Challenges:

Data was collected from the World Health Organization and filtered for “Urban” as the residence area type.

Target Methodology:

This indicator is a subset of Sustainable Development Goal (SDG) 7.1.2, with exclusive focus on urban areas. SDG 7.1 sets a target to ensure universal access to affordable, reliable and modern energy services by 2030, which includes a population with primary reliance on clean fuels and technology (SDG 7.1.2). The target of 100% access by 2030 was chosen to align with the SDG. This indicator exclusively tracks urban population; because, to achieve universal access by 2030, 100% access would also be required in urban areas. 

Cleaner fuels and technologies for cooking can reduce deaths from smoke-related illnesses, mitigate climate change and reduce indoor air pollution. The World Health Organization (WHO) measures the proportion of the population that primarily relies on clean fuels and technologies for cooking, including electricity, biogas, natural gas, liquified petroleum gas (LPG), solar or alcohol fuels.

While urban areas still have greater access to clean cooking than rural ones, this gap is narrowing, as access to clean cooking in rural areas is increasing at a more rapid pace. Access to clean cooking in urban areas has only risen slightly in the past decade, from 81.5% in 2010 to 88.3% in 2022. Because of rapid urbanization, supplying clean energy sources is increasingly challenging in many cities, especially in informal settlements in urban peripheries. Progress has steadily decelerated in urban areas for the past 10 years; if these trends continue, access to clean cooking in urban areas could stall, or even begin declining, as soon as 2025.

Sustainable Development Goal 7 includes a target for access to clean cooking for all by 2030. In 2022, access to clean cooking in urban areas was 88.3%. The rate of progress must increase by a factor of nine in order to reach 100% access in urban areas by 2030.

1674: Urban population without access to clean and reliable electricity

Status: Well Off Track
Historical Data Methodology and Challenges:

Data on urban population with access to electricity was collected, then the inverse values were calculated to determine the percentage of the urban population without access.

Access to electricity is vital to economic productivity and livelihoods, yet millions of urban residents around the world do not have access to clean, reliable energy.

Since 2000, the percentage of people in urban areas without access to electricity has decreased. In 2000, over 5% of urban residents lacked access to electricity; in 2022, 2.3% — still over 100 million people — did not have access.

Between 2019 and 2021, rural areas underwent rapid electrification, outpacing population growth. At the same time, progress flattened in urban areas, partly because they had already achieved higher access rates and partly because rapid urbanization had increased energy consumption and offset access gains.

Cities have a major role to play in how energy is provided and consumed, but in doing so they must face the dual challenge of expanding access to electricity while also meeting increased energy demands. Cities can improve access to clean, affordable and reliable energy by scaling up distributed renewable energy sources, such as solar.

For example, in cities in Kenya, Tanzania and Uganda, community solar has increased access to energy, while lowering costs for households. This lowers air pollution and carbon emissions.

While access to electricity has improved in the last 20 years, the world is still off track to achieve Sustainable Development Goal 7, ensuring access to affordable, reliable, sustainable and modern energy for all. Progress needs to double in urban areas and needs to be 1.9 times faster in all areas (not just urban) to reach energy access for all by 2030.

1675: Urban population without access to safely managed drinking water

Status: Well Off Track
Historical Data Methodology and Challenges:

Data on urban population with access to safely managed drinking water was collected, then the inverse values were calculated to determine the percent of the urban population without access.

Target Methodology:

This indicator is aligned with Sustainable Development Goal (SDG) 6.1, with an exclusive focus on urban areas. SDG 6.1 sets a target to achieve universal and equitable access to safe and affordable drinking water for all by 2030. This indicator tracks the urban population without access, so a target was set at 0% by 2030 (the inverse of the SDG 6.1 target for 100% population with access). This indicator tracks only the urban population; because, to achieve access for all by 2030, there would have to be 100% access in urban areas as well.

According to the World Health Organization, as of 2022, 18.9% of the world’s urban population did not have access to safely managed drinking water. This is only a slight decrease from 19.5% in 2000. Safely managed drinking water is defined as being accessible on premises, available when needed and free from contamination.

However, analysis of data from 15 cities in developing countries show that on average, almost half of all households still lacked access to safe and reliable piped utility water, suggesting that global datasets overestimate the state of water access in these cities and do not take water quality or intermittency of water availability into account. Households that are not connected must rely on self-provision or private water vendors, which can be up to 50 times more expensive than public water.

Sustainable Development Goal 6 aims to ensure access to water and sanitation for all by 2030. In order to reach this target by 2030, progress in urban areas needs to be made more than 10 times faster than recent trends. However, it will become increasingly difficult for cities and water utilities to provide water in urban areas due to climate change — over 650 million people in over 500 cities are expected to see at least a 10% decline in freshwater availability by 2050.

Key enablers and barriers to change

1673: Household income spent on housing

“Affordable” housing is often defined as housing that requires a net monthly expenditure not exceeding 30% of total household income. Based on data from 145 countries, an average 55% of households in Sub-Saharan Africa spend more than 30% of their income on housing, while, in Australia and New Zealand, only about 6% of households spend more than 30% of their income on housing.

Even this threshold is often too high given the proportion of income that must be spent on food and services (such as transport and energy). Recent research suggests that it is more accurate to define affordable housing in terms of housing costs plus transport costs, because this combined measure captures the full and related costs of physical housing, location and connectivity. For example, the Center for Neighborhood Technology’s Housing and Transport (H+T) Index combines data on housing and transportation costs for all zip codes in the United States (U.S.). Based on the traditional measures of affordability, 55% of U.S. neighborhoods are considered “affordable,” but with the H+T Index’s inclusion of transportation costs, that number drops to only 26% of U.S. neighborhoods.

However, it is difficult to measure housing plus transport costs in cities outside of the U.S. because public data is often limited. Therefore, this indicator is separated but highly connected to the indicator on percent of household income spent on transportation costs. Still, this indicator has no data because consistent, accurate data on income and housing costs in cities globally is difficult to find, especially since it needs to take local economic conditions into account. Making housing affordable for the majority of the urban population will require both innovation and incentives, such as affordable, low carbon technologies for building materials and services, and economic incentives to encourage conversion of under-utilized urban land to affordable housing.  

1697: Household income spent on transportation

Transportation provides access to opportunities such as jobs, education and healthcare. For many low-income urban residents, 35% or more of household income is spent on commuting alone and they are often located in peripheral areas further from economic opportunity. This high cost disproportionately burdens low-income residents, limiting their opportunities to thrive.

Decreasing transportation costs is essential to achieving access to safe, reliable transportation for all, which is a target under Sustainable Development Goal 11. Low-income communities could save 25% of their income with more affordable transportation options and shorter commutes.

This indicator is highly connected to the indicator on percent of household income spent on housing costs. Recent research suggests that it is more accurate to define affordable housing in terms of housing costs plus transport costs, because this combined measure captures the full and related costs of physical housing, location and connectivity.

For example, the Center for Neighborhood Technology’s Housing and Transport (H+T) Index combines data on housing and transportation costs for all zip codes in the United States (U.S.). Based on the traditional measures of affordability, 55% of U.S. neighborhoods are considered “affordable,” but with the H+T Index’s inclusion of transportation costs, that number drops to only 26% of U.S. neighborhoods. However, it is difficult to measure housing plus transport costs in cities outside of the U.S. because public data is often limited.

This indicator has no data because consistent, accurate data on income and transportation costs in cities globally is difficult to find, especially since it needs to take local economic conditions into account.

1672: Housing options that are affordable

In cities all over the world, there is not enough well-located urban housing that is adequate, secure and affordable. Access to adequate housing is essential for physical and financial security, healthy communities and overall well-being.

As of 2022, the United Nations Human Settlements Programme (UN-Habitat) estimated that 1.6 billion people lived in inadequate housing conditions, 70% of the world’s households lived with land tenure insecurity, and 15 million people were forcibly and illegally evicted every year. UN-Habitat further estimated that by 2030, 3 billion people — 40% of the world’s population — will need access to adequate housing, which translates into a demand for 96,000 new affordable and accessible housing units every day.

A lack of planned affordable housing stock in cities contributes to the expansion of informal settlements and urban sprawl, which may occur in areas of increased risk such as flood plains, where land is more cheaply available.

Addressing the affordable housing gap can improve economic productivity, environmental sustainability, equity and well-being in cities. Based on an extensive literature review and modeling study, providing adequate housing for people living in informal settlements translates to a 4% increase in life expectancy globally.

There is currently no global dataset that tracks affordable housing as a percentage of the total housing available in all cities. There is also no agreed upon global target, but given that the affordable housing gap is forecasted to grow by 30% by 2050, more affordable housing options are clearly needed.

There is also a lack of data on land ownership and leasing practices within informal settlements, which today provide affordable housing for over a billion people in cities in developing countries. Regulations and incentives — such as allowing for incremental housing improvements, easy-to-understand zoning rules and financial incentives on both the supply and demand sides — are essential to increasing the percentage of affordable housing. 

1868: Cities with granular and disaggregated data on their populations' access to basic infrastructure and services

Cities need granular and disaggregated data in order to make policy and investment decisions. However, many cities lack access to granular and disaggregated data on the availability and quality of basic urban infrastructure and services — including housing, energy, water, sanitation, transportation and waste management — and the impacts on vulnerable communities. Without this level of data, cities must rely on nationally collected data, downscaled to the city level or citywide data. This downscaled or citywide data does not capture the disparities between neighborhoods and can often mask spatial and social inequalities.

Global data on access to water and sanitation, for instance, underestimates the state of access in urban areas because the global data does not look at the quality of the service provided, including the intermittency of supply, water quality, reliability, and affordability. For example, in Bengaluru, India, 79% of the city has access to piped water according to the network data, but in many neighborhoods, the water is only available a few hours a day on only three days a week.

Cities need to increase their capacity to collect and utilize granular data through partnerships with data providers, new technologies and sharing data. However, there is no global dataset that currently monitors the availability of granular and disaggregated data on populations and their access to basic infrastructure and services in urban areas globally.

1869: National funding directed at cities

National governments play an important role in creating more equitable and climate resilient cities. Cities, especially those in the developing countries, often do not have the fiscal capacity for core infrastructure projects or large new programs or services. National governments and national development banks can mobilize funding and financing, especially for large infrastructure projects, that cities cannot mobilize on their own.

National governments collect almost three-quarters of total public revenues worldwide and a portion of this revenue is often allocated to regional and local governments. National governments are also able to get additional funding from banks, multilateral lending agencies and development agencies. Because of this, many cities rely on fiscal transfers from national governments, in the form of grants and subsidies.

Based on research into 101 countries, representing 82% of the world’s population, on average over 50% of subnational government revenues come from grants and subsidies from the national government or international organizations (such as international aid agencies). The amount of revenue to cities from the national government varies greatly by country. As of 2019, in Argentina and Zimbabwe less than 25% of subnational revenue came from national government grants and subsidies, while in other countries such as Peru and Tanzania, grants and subsidies accounted for over over 80% of subnational revenue.

National governments need to fund and finance sustainable and resilient urban infrastructure. However, there is currently no global dataset available for this indicator that tracks the amount of national funding directed at cities in every country.

1870: Amount of multilateral development banks’ climate-related finance directed to urban areas

To address the climate crisis, multilateral development banks (MDBs) will need to work closely with cities, which hold huge investment potential.

Even though the International Finance Corporation estimates that climate-related investment opportunities in cities in low- and middle-income countries will exceed $29.4 trillion by 2030,, there is a shortfall in funding for urban climate investments.

From 2015 through 2022, $62 billion of trackable MDB climate-related finance went to urban areas in low- and middle-income countries, representing about 21% of a total $287 billion in climate-related finance going to low- and middle-income countries over that period.

Additionally, while cities are rapidly growing, the amount of urban climate-related finance from MDBs has not increased. In fact, while MDBs have increased the amount of general climate-related finance, the amount going to urban areas has not kept pace, resulting in a decrease in the share of MDB climate-related finance that is dedicated to cities.

Only about 7% of trackable MDB climate-related finance went to urban adaptation efforts, compared to 18% that went to other adaptation efforts. Given rapid urbanization and the impacts of climate hazards like extreme heat, flooding and coastal storms on cities, there is still a pressing need to accelerate urban climate-related finance to both adaptation and mitigation. However, there is currently no global dataset available for this indicator that tracks the amount of multilateral development banks’ climate-related finance to urban areas each year.

1871: Private sector climate investment in cities

In order to protect urban infrastructure from climate risks, the estimated global annual investment required is $11 billion-$20 billion by 2050. While some of this will come from national governments and international organizations, cities will also need private sector investment to support mitigation and adaptation to climate change.

In 2018, $136 billion of urban climate finance came from private finance. One-third of this total came from household expenditures, such as purchasing private electric vehicles or energy efficient improvements to residential buildings. This indicator tracks the other two-thirds of this total that come from the private sector itself, such as from commercial banks and investors, and does not include household expenditures.

The CPD-ICLEI Track, a voluntary climate reporting platform for cities, found that of 1,782 climate infrastructure projects that were reported, 38% of the projects planned to use more than one source of finance or financial instrument such as loans from commercial banks, bonds, carbon markets, and leveraging private investment, equity and blended finance.

In order to attract private investment in climate resilient neighborhood or citywide projects, cities can work with development finance institutions, national governments and the private sector to strengthen the city’s credit and regulatory environment. Some examples of private finance mechanisms include green bonds, public-private partnerships and market-based instruments.

There is currently no comprehensive data available for this indicator.

1872: Cities generating and allocating their own-source revenues

National governments collected almost three-quarters of total public revenues worldwide as of 2019, and many cities rely on revenues from national government grants and subsidies. Another indicator in the Cities system tracks the amount of national government funding that cities receive.

However, cities can increase revenue and improve fiscal autonomy by improving their own-source revenues, such as property taxes, user fees, parking charges or any other direct municipal revenues. This allows cities to provide better urban infrastructure and services that meet citizen demand and fit their unique needs.

Cities with the authority to generate their own-source revenues are better able to fund necessary urban services and close the infrastructure financing gap, provided they have the requisite capacity. Generating own-source revenue also leads to more transparency, fiscal accountability and better public engagement. Additionally, local taxes and fees are often more stable and consistent than other forms of finance.

UN Habitat’s Rapid Own-Source Revenue Analysis tool can help cities optimize their own-source revenues by self-diagnosing their weaknesses and bottlenecks.

There is currently no comprehensive data available for this indicator.

Other shift Other shifts needed to transform the system

Plan urban land use to reduce emissions and increase climate resilience

Land use planning that limits urban sprawl and promotes connectivity to infrastructure and services can reduce emissions, provide better access to opportunities and improve resilience to climate risks.

Improve urban waste management and transition to zero-waste cities

The world is rapidly urbanizing, but methods of collecting and disposing waste in many cities, especially in developing countries, remain haphazard. Effective waste management and methane capture in cities can reduce emissions and offer cleaner, healthier living environments.