Achieving the goal of sustainable, low-carbon transport demands a comprehensive approach. We need to avoid unnecessary trips, shift travel to more sustainable modes, improve transport technology and increase access to jobs and opportunities. 
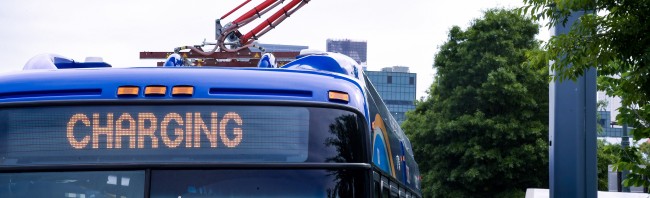
Viewed in the context of this Avoid-Shift-Improve framework, most policies to date have prioritized improve” over “avoid” and “shift” solutions. 

Rethinking the way we get around allows us to shift to lower-emitting modes while improving quality of life.

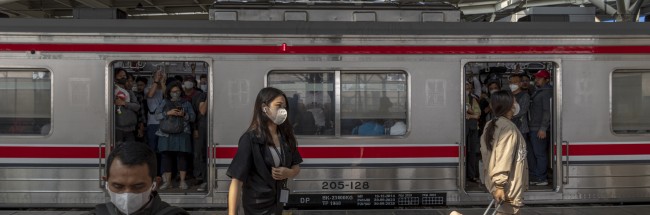
Focusing on land use and mobility planning, public transport, cycling and walking can offer simple solutions to combat urban congestion and air pollution. Public transport, including so-called “informal transport,” is especially critical in urban areas, where it can be the most accessible, efficient and safest means of transportation. In many cities and in disconnected areas, residents who do not have convenient transportation may be either underserved or trapped into extraordinarily long commutes that hinder access to opportunities, medical care and other necessary services.

Many barriers have prevented the widespread adoption of active options like cycling: the limited availability of protected bike lanes, unfavorable weather conditions, topographical challenges, social perceptions associated with biking, and the perceived risk that local businesses will suffer if car access is diminished or denied. If cities and urban centers can overcome these impediments, they could propel a transition to a low-carbon future.

Active mobility (cycling or walking) and micromobility (shared bikes, e-bikes and scooters) could eliminate as much as 50-70% of short car trips (0-5 kilometers). But making roads safe and convenient for cyclists and pedestrians will be an essential first step. Copenhagen and Bogotá have demonstrated that, despite challenges such as long winters or mountains, well-planned biking infrastructure increases daily bike use and can create a vibrant cycling culture.

Data Insights

What targets are most important to reach in the future?

Systems Change Lab identifies 2 targets toward which to track progress. Click a chart to explore the data.

What factors may prevent or enable change?

Systems Change Lab identifies 7 factors that may impede or help spur progress toward targets. Click a chart to explore the data.

Progress toward targets

Systems Change Lab tracks progress toward 2 targets. target. Explore the data and learn about key actions supporting systems change.

Rapid transit coverage in cities

To achieve a sustainable pathway, rapid transit in cities should reach 38 kilometers per million people by 2030, requiring efforts from the last five years to increase by 6x.

Buses and trains will be a crucial component of decarbonizing the transport sector. They currently release about a quarter of the emissions per passenger-kilometer (pkm) as compared to emissions generated by ride-hailing services and about half of those from a private vehicle. 

Across the world’s 50 highest-emitting cities, the number of kilometers (km) of rapid transit per million people has increased over time, from 16 km in 2010 to 19 km in 2020. These include metro, light rail and bus rapid transit (BRT), which uses a dedicated lane to avoid the causes of delay that typically slow regular bus service. Europe outpaces the rest of the world in terms of its rapid transit-to-resident ratio, followed by Chile, Ecuador, South Korea and Tunisia. 

To achieve a pathway compliant with the 1.5 degrees C (2.7 degrees F) target, rapid transit in cities would need to reach 38 km per million people by 2030. This would require the pace of change achieved over the last five years to increase by 6 times.

While the amount of public funding is not included in this metric, it is important that cities provide broader support to public transport systems, including rapid transit and bus services. Policies that address informal popular transport systems, such as minibuses, are also needed. 

Bike lane coverage in large cities

If 10% of the population were to change travel behavior from taking a car to cycling, transportation emissions would be expected to decrease by about 10%.

Access to high-quality bike lanes is key because it can foster a shift to a near-zero-carbon form of transport and improve the safety and health of residents. In a recent study of European cities, cyclists had 84% lower carbon dioxide (CO2) emissions per person from all daily travel than non-cyclists. 

If 10% of the population were to change travel behavior from taking a car to cycling, transportation emissions would be expected to decrease by about 10%. Cycling is a clear tool for policymakers to use now to address climate change.

In 2022, there were approximately 0.0044 kilometers (km) of segregated bike lanes per 1,000 people in the top 50 highest emitting cities. This is an increase from 0.0001 km/1,000 people in 2010.

In order to be on a 1.5 degrees C pathway, this number needs to increase to 2 km/1,000 inhabitants by 2030. Progress will need to accelerate more than 10 times to meet this goal. Of course, building infrastructure will not guarantee people will use it, but it is a necessary condition — alongside other incentives for mode shift — to allow for better cycling access.

Bike use surged during the COVID-19 pandemic, and countries and cities can capitalize on that interest and prioritize cycling. European countries like Denmark, Germany and the Netherlands are world leaders in creating safe, convenient and accessible cycling conditions. 

Cities looking to expand cycling infrastructure can also follow the example of Seville, Spain, where the local government expanded cycling infrastructure from 12 km of unconnected cycle paths in 2005 to 120 km of protected bike lanes in 2010. The expansion was coupled with a bike-sharing system, which helped boost the number of daily bike trips five-fold over three years. 

Cities like Paris are setting bold aspirations for cyclability. Paris’s goals include making it possible to bike every street in the city and prioritizing pedestrians and cyclists over cars in the flow of traffic.

Enablers and barriers

We also monitor change by tracking a critical set of 7 factors factor that can impede or help spur progress toward targets. Explore the data and learn about key actions supporting systems change.

Number of countries with announced mode shift targets prioritizing public transport

By setting a target to increase the modal share of mass transit, governments can meet transport demand while improving air quality and increasing citizens’ physical activity.

Over the last century, countries from the United States to Kenya have emphasized cars as a mode of transport, expanding highway systems and increasing speed limits. This approach will need to shift from prioritizing traffic speed to enabling the movement of people: providing equitable, safe and widespread access to employment, services and recreation. 

By setting a target to increase the modal share of mass transit, governments can meet transport demand while improving air quality and increasing citizens’ physical activity. While these policies are typically implemented at the city level, national governments can set a pathway for cities to follow. According to their most recent Nationally Determined Contributions as of September 2023, 11 countries have established mode shift targets prioritizing public transport: Albania, Bangladesh, Cabo Verde, China, Costa Rica, India, Jordan, Malawi, Namibia, Palestine and Zimbabwe.

Key steps to achieve ridership targets include implementing bus rapid transit and other rapid transit. Measures to reduce demand for vehicle travel can help as well. These could include congestion charges; parking policies and smart land use; investing in public transport operations that improve quality, reliability, frequency and affordability; integrating and digitizing fare payment systems to make transit use easy and convenient; and providing safe and secure services.

Number of countries with walking and bicycling plans

Active mobility has immense untapped potential to bring numerous economic, environmental, health and social benefits to the community. As of 2019, 103 countries had established policies to encourage walking and bicycling.

Historically, nationally and locally designated funds for active mobility have been lacking. However, as the climate crisis looms and the COVID-19 pandemic persists, the importance of active mobility is gaining ground. Shifting to walking and cycling can drastically reduce emissions and is the quickest and most efficient way to decarbonize transport. As of 2019, the only year for which data is available, 103 countries had established policies to encourage walking and bicycling.

Active mobility has immense untapped potential to bring numerous economic, environmental, health and social benefits to the community. Between March and July 2020, at least 394 cities, states and countries reallocated spaces for people to cycle and walk. These pop-up bike lanes need to be well-planned and combined with slower speed limits and protected bicycle lanes to avoid collisions.

Number of countries investing in non-car modes

Every $1 invested in public transportation generates $5 in economic returns, and every $1 billion in investments supports and creates approximately 50,000 jobs.

Many public transport systems lack sustainable government support for operations — a fact made evident during the COVID-19 pandemic, when ridership and fare revenue dropped. In Vienna, for example, fares cover just above half of operational costs, and the national government supplements these revenues with steady indirect payments, a public transport tax on large employers, and fees from on-street parking and city-owned parking garages. 

Congestion charges are another way to provide revenue for a wide-scale, city-level repositioning of public transport. In London, for instance, over £1.3 billion in such revenue over 14 years was reinvested in public transit, achieving a 30% reduction in congestion and a 38% increase in bus passenger numbers. 

Investing in public transport will also have positive impacts on the economy. Every $1 invested in public transportation generates $5 in economic returns, and every $1 billion in investments supports and creates approximately 50,000 jobs. There is no publicly available data for countries’ spending on non-car modes. This type of data likely exists at the national or sub-national level but would need to be collected and aggregated by an international source with sufficient resources.

Number of jobs in sustainable modes, including passenger transport by bus, train or cableway

Compared to private cars, public transport systems offer lower emissions and more green jobs; however, employment statistics for urban public transport are incomplete and trends vary considerably.

Compared to private cars, public transport systems offer lower emissions and more green jobs. Employment statistics for urban public transport are incomplete and trends vary considerably. In 2013, the International Association of Public Transport estimated that 13 million people around the world worked in public transit — a statistic still cited today by the International Labor Organization.

An increasing number of jobs in sustainable transportation indicates that the transition toward greener transportation is creating employment opportunities. A working paper from 2021, based on literature review and analysis, found that investing in multiple types of public and non-motorized transportation generally creates more jobs than investing in roads. Three out of four relevant studies also found that investing in mass transit creates more near-term jobs than investing in roads, with a median of 1.4 times as many per $1 million invested.

A study of projects in 11 cities in the United States (U.S.) found that investing in cycling infrastructure creates 1.5 times more jobs than roads and investing in walking infrastructure creates 1.3 times more jobs than roads per $1 million.

However, it’s essential that new employment opportunities provide men and women with decent work, meaning that they should offer fair compensation, safe working conditions, equal opportunities and social protection. These jobs must be free of forced and child labor, and provide employees the right to organize or discuss work-related issues, among other conditions.

Bus rapid transit ridership

In 2022, bus rapid transit ridership rates stood around a global total of 32 million passengers per day, equivalent to less than one percent of the world’s total urban population.

Bus rapid transition (BRT) systems can play an important role in zero-carbon transport systems by offering an affordable, scalable and rapidly deployable public transport option. BRT systems differ from conventional bus systems because they incorporate lanes dedicated only to those buses, removing most of the traffic from other vehicles. BRT systems have been particularly successful in developing and emerging economies, where they have provided metro-like services but at a fraction of the cost and rollout time.

In 2022, BRT ridership rates stood around a global total of 32 million passengers per day, equivalent to 0.7% of the world’s total urban population. Ridership was predominantly concentrated in Brazil (7.5 million people, 4% of the country’s urban population), China (4.4 million people, 0.5% of the country’s urban population), Colombia (3.1 million people, 7% of the country’s urban population), Mexico (2.7 million people, 3% of the country’s urban population) and Iran (2.1 million people, 3% of the country’s urban population).

Buses release as little as a fifth of the emissions of ride-hailing, and about a third of the emissions of private vehicles per passenger-kilometer traveled. Electric buses can deliver even greater emissions reductions, especially if powered by zero-carbon electricity.

Total investment in rapid transit systems

The growth in rapid transit systems needs to accelerate six-fold to achieve 2030 targets, requiring a commensurate increase in investment.

Rapid transit systems, which encompass transport modes such as metros, light rail and bus rapid transit (BRTs), are crucial for decarbonizing the transport sector, particularly in urban areas. Rapid transit systems emit only half the emissions of private vehicles per passenger-kilometer (pkm) traveled.

This indicator tracks total annual investments in rapid transit systems. While there is no publicly available data for this, it is understood that the coverage of rapid transit systems is increasing in these 50 cities.

In 2010, coverage levels stood around 16 kilometers (km) of rapid transit infrastructure (such as metro tracks or dedicated BRT lanes) per million people in the 50 highest emitting cities; this increased to 19 km/million by 2020. Therefore, we estimate (by proxy) that investments in rapid transit networks have increased at modest rates.

Rapid transit systems need to rise sharply in this decade to align with 1.5 degrees C (2.7 degrees F) compatible pathways. By 2030, rapid transit coverage should reach 38 km per million people in the 50 highest emitting cities, requiring a six-fold increase in the current growth rate. This requires a commensurate increase in investments for rapid transit systems. 

Total investment in bike lanes

The growth in high-quality bike lanes needs to accelerate ten-fold to achieve 2030 targets, requiring a commensurate increase in investment.

High-quality bicycle lanes have myriad benefits in urban areas: reduced emissions, improved air quality, eased congestion, and lower energy demands, as well as significant public health benefits, among others. Cycling should be a priority in all major cities’ decarbonization strategies.

Evidence suggests that if 10% of the global population were to shift from taking a car to cycling, we could expect to see a 10% reduction in the transport sector’s emissions. Making this switch for even one or two trips per day can lower per capita emissions by 84% compared with non-cyclists.

This indicator tracks total annual investments in high-quality bike lanes in the 50 highest-emitting cities. While there is no publicly available data for this, it is understood that the coverage of bike lanes is increasing in these 50 cities.

In 2010, there were around 0.0008 kilometers (km) of segregated bike lanes per 1,000 people in the 50 highest emitting cities; by 2022, this increased to 0.0044 km per 1,000 people. Therefore, we estimate (by proxy) that investments in rapid transit networks have also increased at modest rates.

Globally, bike lane coverage in the 50 highest emitting cities should reach 2 km per 1,000 people by 2030 to be on a 1.5 degrees C pathway. Progress will need to accelerate more than 10 times to meet this goal. This requires a commensurate increase in investments for bike lane infrastructure.