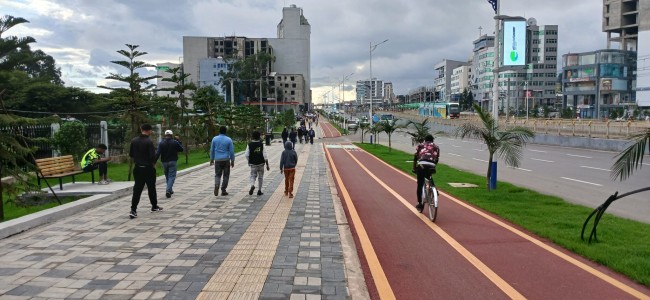
Photo by Bruce Hong via Unsplash

Equitable and affordable access to clean water and safe sanitation and hygiene services are essential for human health, ecosystem protection and climate resilience. However, billions of people, particularly those with the fewest resources, are still being left behind.

Equitable access to affordable, clean water, as well as safe sanitation and hygiene services, is essential

Access to clean water, adequate sanitation and proper hygiene is foundational to human health, dignity and sustainable development. Water, sanitation and hygiene (WASH) encompasses drinking water services, sanitation services and hygiene practices that together protect people from water‑related disease and environmental contamination. Expanding access to clean water and WASH services remains a critical global challenge.

Each WASH component has a distinct meaning. Safe drinking water is water that poses no significant risk to health over a lifetime and is reliably available when needed. Sanitation refers to facilities and services for the safe disposal of human waste — for example, household flush toilets connected to functional septic tanks or fully contained pit latrines. Hygiene covers the conditions and practices that maintain health and prevent spreading disease transmission, including hand-washing, food hygiene and menstrual hygiene management.

WASH interventions focus on improving equitable access to clean water, sanitation and hygiene, especially in underserved or vulnerable communities. One recent progress report finds that as of 2024, 2.1 billion people still lacked access to clean water, 3.4 billion lacked safely managed sanitation and 1.7 billion lacked basic hygiene services. Common interventions include expanding safe water access through wells, boreholes and water treatment and distribution systems, alongside constructing or upgrading sanitation facilities and sewer networks to safely contain, transport, treat and dispose of human waste.

Safe, sufficient WASH services are important not only for health, livelihoods, education and dignity but also for supporting shifts toward the sustainable use of global freshwater resources, including minimizing disruptions and pollution in the water cycle, restoring freshwater ecosystems and halting further degradation. Freshwater flows and stocks directly affect the quantity and quality of water available for WASH, and in turn, effective WASH practices help prevent pollution and overuse of vital water resources such as lakes, rivers and groundwater. For this reason, efforts to protect, restore and sustainably manage freshwater ecosystems must advance in parallel with efforts to universalize access to WASH.

In practice, WASH interventions — including modernizing pipelines, treating and reusing wastewater, and installing low-flow toilets — can reduce the total water withdrawn from freshwater sources. Yet significant inefficiencies remain: about 40% of potable urban water supply is lost through leakage and system inefficiencies. Closing this and other gaps is a major opportunity to reduce water waste while improving reliable, efficient access in the face of intensifying climate stress. WASH also plays a critical role in enhancing communities’ climate resilience by strengthening their ability to withstand floods, droughts and other climate-related water risks.
 

Global inequalities in clean water access

Access to WASH services remains highly inequitable between and within countries, as well as across gender, socioeconomic status and rural-urban divides. In most countries, for example, women and girls continue to be primarily responsible for water collection, often spending more than 30 minutes per day — a burden concentrated in Africa and central and southern Asia. 

The recent expansion of privatized water and sanitation services, particularly in low-income countries, has significant implications for equitable access and effective governance. While privatization can improve infrastructure, without appropriate regulation and safeguards against monopolization, these benefits may be limited, unevenly distributed or never achieved. When people are not connected to public water systems and must rely on private water tankers and vendors, they may end up paying 6-10 times more than households connected to piped networks.
 

Expanding access to clean water and sanitation

Achieving universal access to clean water and sanitation will require both private and public sources of finance to meet the scale of investment needed, alongside strengthening and expanding sources of finance — including increasing international support for developing countries — to achieve global development targets.

The U.N. Sustainable Development Goals established ambitious global targets for achieving universal and equitable access to safe and affordable drinking water (Target 6.1) and sanitation and hygiene (Target 6.2) by 2030. Although many countries are seeing improvements, the world is not on track to reach these targets.

Accelerating progress will require improving water governance, strengthening institutional capacity, customizing financing strategies, and enforcing regulations and laws related to water management and water rights. Governments must also ensure that solutions prioritize the needs of underserved and marginalized groups — including women, Indigenous Peoples, Afro-descendant and local communities, and low-income households — and enable their meaningful participation in planning and decision-making.

Tracking progress on global outcomes

7641: Access to clean water, as measured by the share of the population using safely managed drinking water services

Status: Well Off Track
Historical Data Methodology and Challenges:

Data for the share of population with access to safely managed drinking water is directly derived from  the Joint Monitoring Programme (JMP) of the World Health Organization (WHO) and the U.N. Children’s Fund (UNICEF). Country-level data recorded as “>1” is estimated to 1% while “>99” is estimated to 99%. Time series data have been available for the basic level of drinking water service since 2000, while elements of safe management were not collected during the Millenium Development Goal period from 2000 to 2015, which preceded the Sustainable Development Goals (SDGs). Census, household survey, administrative and other complementary data (e.g., from regional or international initiatives) is collected by JMP on a biennial basis, with estimates of safely managed drinking water produced by JMP followed by detailed national consultations facilitated by WHO and UNICEF country offices. The data collection process begins in even years, with estimates published during the following year. National statistical offices are responsible for ensuring data quality, with the JMP setting criteria for accepting data based on representativeness, quality and comparability. Consultations with national data providers help to improve the quality and consistency of global water, sanitation and hygiene (WASH) estimates.

Target Methodology:

Increasing access to clean water is particularly relevant for enabling sustainable development. For indicators that primarily focus on building a more just and equitable future, we present targets from the Sustainable Development Goals wherever possible. As SDG 6.1 calls for achieving universal and equitable access to safe and affordable drinking water for all by 2030, we set our target for the share of the global population using safely managed drinking water at 100%.

Access to clean water is a fundamental human right that underpins social, economic and public health outcomes. While definitions vary, the World Health Organization (WHO) and UN Children’s Fund (UNICEF) Joint Monitoring Programme (JMP) for Water Supply, Sanitation and Hygiene define safely managed drinking water services as the proportion of the “population drinking water from an improved source that is accessible on premises, available when needed and free from faecal and priority chemical contamination.”

Although a useful proxy, this indicator measures access to improved drinking water at the service level — defined by source type and service conditions — rather than directly measuring whether every person actually accesses and consumes clean water consistently. This indicator may not capture all sources of contamination, and it does not account for alternative technologies or practices that can provide access to clean water. While data on household drinking water sources, availability and safety is increasingly accessible through household surveys and administrative records, standard definitions are still in development.

Since 2000, the share of the population with access to safely managed drinking water has steadily increased. In 2024, 74% of the world’s population had access to safely managed drinking water; a 13% point increase over 2000 levels. Despite this progress, more than a quarter of the world’s population still lack access, and the gains remain uneven. For example, in 2024 only 60% of the world’s rural populations had access to safely managed drinking water, compared to 84% of urban populations — and drinking water coverage in urban areas has now stagnated. 

Further efforts to improve the quality of freshwater sources, in addition to scaling infrastructure for the provision of freshwater, will be necessary to achieve the SDG target of universal access to safe drinking water.

7610: Access to adequate sanitation services, as measured by the share of the population using safely managed sanitation services

Status: Well Off Track
Historical Data Methodology and Challenges:

Data for the proportion of the population using safely managed sanitation facilities was directly derived from the Joint Monitoring Programme (JMP) of the World Health Organization (WHO) and UN Children’s Fund (UNICEF). Country level data recorded as “>1” is estimated to 1%, while “>99” is estimated to 99%. Census results, household surveys, administrative records and other supplementary data such as the international and regional compilations of sanitation service-related data are collated by JMP on a biennial basis, with estimates of coverage of sanitation services produced by JMP followed by detailed national consultations facilitated by WHO and UNICEF country offices. The data collection process begins in even years, with estimates published during the following year.

Target Methodology:

Increasing access to adequate sanitation and hygiene services is particularly relevant for enabling sustainable development. For indicators that primarily focus on building a more just and equitable future, we present targets from the Sustainable Development Goals wherever possible. As SDG 6.2 calls for ending open defecation and providing access to sanitation and hygiene by 2030, we set our target for access to adequate sanitation and hygiene services at 100%.

Expanding global access to adequate sanitation and hygiene services — with special attention to women and girls in vulnerable situations — is necessary not only to realize a fundamental human right but also to achieve healthy and sustainable freshwater ecosystems.

Effective water, sanitation and hygiene (WASH) programs can prevent contaminants from reaching freshwater systems, reduce risks of waterborne illnesses and limit environmental events such as algal blooms that can cause die-offs of freshwater animals.

In conjunction with achieving universal and equitable access to safe and affordable drinking water for all by 2030, U.N. Sustainable Development Goal Target 6.2 also aims to increase the share of the global population using safely managed sanitation services and a hand-washing facility with soap and water.

The share of the global population with access to safe sanitation services has increased from 31% in 2000 to 58% in 2024, with significant progress still needed to achieve access to adequate and equitable sanitation and hygiene by 2030. Efforts will need to increase more than fivefold to reach the 2030 target.

Progress within countries has been uneven. Access to safe sanitation services is greater in urban areas, increasing from 48% in 2000 to 66% in 2024. Rural access increased from 17% to 49% during the same period, showing that rural areas, despite steady progress, still lag behind overall. However, a report examining global progress since 2015 on household drinking water, sanitation and hygiene found that progress in safely managed sanitation and basic hygiene has been slower in urban areas and low-income countries compared to rural areas. Further efforts are also needed to address inequities in sanitation service access and delivery.

Measuring the proportion of the population using safely managed sanitation services is employed as a proxy for sanitation outcomes. However, this measures access to particular types of sanitation solutions — such as flush toilets connected to sewer systems or ventilated improved pit latrines — rather than directly measuring whether every person routinely uses adequate sanitation.

7611: Access to adequate hygiene services, as measured by the share of the population using basic hygiene services, including a hand-washing facility

Status: Well Off Track
Historical Data Methodology and Challenges:

Data for the proportion of the population using hygiene services was directly derived from the Joint Monitoring Programme (JMP) of the World Health Organization (WHO) and UN Children’s Fund (UNICEF). Country level data recorded as “>1” is estimated to 1% while “>99” is estimated to 99%. Census results, household surveys, administrative records and other supplementary data such as the international and regional compilations of sanitation service-related data are collated by JMP on a biennial basis, with estimates of coverage of sanitation services produced by JMP followed by detailed national consultations facilitated by WHO and UNICEF country offices. The data collection process begins in even years, with estimates published during the following year.

Target Methodology:

Increasing access to adequate sanitation and hygiene services is particularly relevant for enabling sustainable development. For indicators that primarily focus on building a more just and equitable future, we present targets from the Sustainable Development Goals wherever possible. As SDG 6.2 calls for ending open defecation and providing access to sanitation and hygiene by 2030, we set our target for access to adequate sanitation and hygiene services at 100%.

Expanding global access to adequate sanitation and hygiene services — with special attention to women and girls in vulnerable situations — is necessary not only realizing a fundamental human right, but to achieve healthy and sustainable freshwater ecosystems.

Effective water, sanitation and hygiene (WASH) programs can prevent contaminants from reaching freshwater systems and reduce risks of waterborne illnesses.

In conjunction with achieving universal and equitable access to safe and affordable drinking water for all by 2030, U.N. Sustainable Development Goal Target 6.2 also aims to increase the share of the global population using safely managed sanitation services and a hand-washing facility with soap and water.

Data sourced from the Joint Monitoring Programme (JMP) for Water Supply, Sanitation and Hygiene of the World Health Organization (WHO) and UN Children’s Fund  reveal that the share of the global population with access to basic hygiene services has increased in the last twenty years, reaching 80% in 2024. In urban areas, access rose slightly from 84% in 2017 to 86% in 2024, while rural areas saw faster progress, increasing from 62% to 71% over the same period.

The number of people lacking basic hygiene services has increased in low-income countries and decreased in lower-middle-income countries, revealing a key discrepancy based on income. Further efforts are also needed to address inequities in hygiene service access and delivery.

Measuring the proportion of the population using basic hygiene services is used as a proxy for hygiene outcomes. However, this proxy measures access to particular types of hygiene solutions — such as handwashing facilities near toilets — rather than directly measuring whether every person consistently practices adequate hygiene.

7584: Access to menstrual hygiene products and private changing spaces

Status: Insufficient Data
Historical Data Methodology and Challenges:

A limitation of data collected for this indicator and others like it is that the data focuses on women and girls aged 15 to 49, instead of all women and menstruating people. The number of countries included in the study were 3 in 2020, 4 in 2021, 8 in 2022, 13 in 2023 and 42 in 2024.

Target Methodology:

Increasing access to menstrual hygiene products and private changing spaces is particularly relevant for enabling sustainable development. For indicators that primarily focus on building a more just and equitable future, we present targets from the Sustainable Development Goals wherever possible. SDG 6.2 calls for achieving access to adequate and equitable sanitation and hygiene for all by 2030, paying special attention to the needs of women and girls and those in vulnerable situations. In line with this goal, we set our target for access to adequate sanitation and hygiene services at 100%.

Women, girls and other people who menstruate need access to clean materials that can be changed in privacy with access to water and facilities for disposal, which is a key measure of menstrual health and hygiene within water, sanitation and hygiene (WASH). It is also important for ensuring that women and girls, who make up half of the world’s population, can manage menstruation safely and with dignity. Monitoring this type of access serves as a proxy indicator on whether sanitation services are gender-responsive.

Globally, each month about 1.8 billion people menstruate, and an estimated 500 million lack access to menstrual products and facilities. Inadequate menstrual hygiene is associated with higher rates of infections, especially when people who menstruate cannot wash properly or must reuse or improvise menstrual materials. Moreover, inadequate supplies and facilities, coupled with stigma and shame about menstruation, negatively affect people’s participation in school, work, community and other regular activities.

Available national survey data shows large disparities between and within countries, and between rural and urban areas, with inequalities more prevalent in rural areas. In 2024, a majority of the 42 countries in the survey reported that a high proportion of people have a private place to wash and change during menstruation. While some countries show promising results, more data and research are needed to gather a complete global picture for the many other nations that are not part of these studies.

Key enablers and barriers to change

7565: Urban population growth in water-stressed basins

Historical Data Methodology and Challenges:

Three global datasets were used in this analysis. We used the WRI Aqueduct 4.0 Baseline Water Stress to classify river basins considered high or extremely high water-stressed. The GHS-SMOD R2023A dataset was used to identify urban areas, while the GHS-POP R2023A dataset provided a global urban population grid. Country boundaries from Natural Earth were used to produce a supplementary country-level dataset. For each available year, the urban settlement map was combined with the population grid to identify people living in urban areas. This urban population data was then overlaid with the water-stressed river basins from the Aqueduct dataset to calculate total urban population living within those basins. Since the Aqueduct water stress layer is static and represents long-term average conditions rather than annual changes, trends in this indicator reflect changes in the distribution and growth of urban populations rather than changes in water stress itself. For analyses of how water stress changes over time, the AQUASTAT SDG 6.4.2 indicator is more appropriate, as it is updated over time at the national level and captures changes in water stress conditions.

The world’s urban population is expected to increase drastically by 2050, with an estimated two-thirds of global population growth expected to occur in cities. This trend places growing pressure on WASH systems, particularly in water-stressed basins where rising urban demand is already straining or exceeding available supply.

Cities must also often compete for water with agriculture, industry and other sectors, which can decrease water supply for urban populations, leading to disruptions, rationing, reductions in service quality or rising tariffs. Climate change will further intensify these pressures by shifting precipitation patterns and increasing the frequency and severity of droughts in some places, further reducing the reliability and availability of surface water resources. Critically, these negative effects will continue to disproportionately affect urban households living in poverty and informal settlements — people who are already exposed to additional health risks and vulnerabilities.

A 2018 study of 482 of the world’s largest cities found that 27% will face water demands exceeding surface water availability in the future. In 2025, 2.9 billion people were estimated to live in cities within water-stressed basins, up from 2 billion in 2000. Cities unable to replenish their water basins may have to resort to expensive solutions such as building infrastructure for desalination plants, long-distance transfers, or groundwater extraction — all of which come with their own trade-offs.

7647: Population threatened by flood risk, as measured by the share of the population living in a flood zone

Historical Data Methodology and Challenges:

We used four datasets to estimate the number of people living in a flood zone over time. Fluvial (river) data came from the Joint Research Centre Global River Flood Hazard Maps, while coastal flood data came from the WRI Aqueduct Floods dataset. Population estimates were taken from the Global Human Settlement Population dataset for 2000, 2005, 2010, 2015, 2020 and 2025. River basin boundaries were defined using the WRI Aqueduct HydroBASINS dataset. For each population year, we identified the proportion of each population grid cell that falls within either a river or coastal flood zone. These flood-exposed population estimates were then summed for each river basin and country. The flood hazard layers are static across epochs. As a result, interyear change reflects changes in where people live relative to these flood-prone areas, rather than changes in the flood hazard itself. As defined by the datasets used in this indicator, the coastal flood zone represents flooding from storm surges and occurs along coastlines around the world during a 1-in-100-year flood event. The fluvial flood zone represents river flooding during a 1-in-100-year flood event.

Just as water stress and scarcity are afflicting communities and ecosystems around the world, crises are also driven by too much water. Floods are the most economically consequential natural disasters in recent history, unleashing devastating impacts for people and ecosystems: Since 1980, floods have comprised 86% of all weather-related economic damages, and in 2023 alone, they accounted for nearly $130 billion in damages.

In water, sanitation and hygiene (WASH) terms, flooding can undermine and stress service continuity by damaging water supply and wastewater systems, inundating sanitation facilities, contaminating water sources and increasing the risk of fecal exposure and waterborne and infectious diseases.

As human-driven climate change, dam failure events and other disruptions to the world’s water cycle continue to propel the increased frequency and severity of these damaging flooding events, the number of people exposed to flood-related risks — including disruptions to safe drinking water, sanitation and hygiene services — is also rising. Specifically, 1.4 billion people were estimated to be living in a flood zone in 2025, up from 1 billion in 2000.

Although there is no single consensus target for reducing the share of the population threatened by flood risk, U.N. Sustainable Development Goal 11.5 calls for significantly reducing the number of people affected by natural disasters, including water-related disasters such as flooding. Yet data indicates that the world is coming up short: The population threatened by flood risk is still growing, moving in the wrong direction entirely.

7578: Continental drying, as measured by average annual terrestrial water storage anomaly

Historical Data Methodology and Challenges:

Terrestrial water storage (TWS) data was sourced from the Gravity Recovery and Climate Experiment (GRACE) Follow-On Zenith Path Observations (GFZOP) dataset. TWS data was extracted for two spatial aggregations — river basins and climatically similar regions — which produced identical values and are therefore not differentiated. Monthly data was averaged to produce annual global values. Uncertainty estimates exist for each month, though they must be viewed directly at the data source.

Over the last several decades, the world has seen the emergence of a global continental drying phenomenon in which large landmasses have experienced a long-term decline in both ground and surface water availability. Climate change-driven shifts in precipitation, evaporation and streamflow, as well as water and land management decisions that contribute to growing surface water and groundwater withdrawals, are resulting in global freshwater reserves being replaced by megadrying regions at alarming rates. Critically, while there is building evidence that climate change is making both dry areas drier and wet areas wetter, dry areas are drying faster than wet areas are wetting, compounding water insecurity in already vulnerable settings.

One study found that, in the Northern Hemisphere, areas experiencing drying have been increasing by twice the size of California annually, and since 2002, 75% of the global population has lived in an area that is losing freshwater.

Continental drying has serious implications not only for livelihoods and ecosystems but also for equitable access to WASH services. Declining surface and groundwater availability can reduce the reliability of drinking water sources, increase dependence on lower-quality or more expensive or distant supplies, raise treatment and pumping costs, and heighten the risk of unsafe storage and contamination. It can also negatively impact rural and urban water supply systems, constraining the capacity of utilities and communities to maintain continuous service.

In sanitation, reduced water availability can limit the usability and performance of sewer-connected systems as well as undermine hygiene practices like hand-washing. Increased aridity and reduced freshwater supply also increase competition for freshwater, threatening agricultural productivity and jobs in farming communities, reducing capacities for climate adaptation and increasing the frequency and severity of wildfires.

Recent studies measuring global continental drying rely on satellite data that measures the world’s terrestrial water storage (TWS), or the total amount of water stored on land, both on and below the surface. When this value declines, continental drying is occurring. Although scientific literature has not identified a clear, quantitative global target for TWS levels that would be sufficient to prevent adverse impacts of continental drying, the urgency of halting this trend is clear. Unfortunately, most recent data shows an increasingly negative anomaly in terrestrial water storage as compared to the monthly average between 2002-2020, showing that TWS levels have been declining steadily since around 2012.

7580: Interannual variability of surface water supply

Historical Data Methodology and Challenges:

A total of 209 countries are included in the Aqueduct study. Scores range from 0 (best) to 5 (worst), with 0 indicating very stable, predictable water supply year over year; 1 indicating low-medium instability; 3 medium-high instability; 4 high instability; and 5 indicating extremely unpredictable water supply, with large swings between wet and dry years. Aqueduct produces a score for each water basin within a given country (one HydroBASIN Level 6 subbasin or a watershed polygon), meaning the dataset includes multiple rows per country. We averaged the scores across each country’s water basins to obtain an overall country score for each country. We did not include scores that were not assigned to a country, missing, or for those geo tags marked as XAD, XKO and XNC.

Limitations of the study are that it prepares calculations over a long period of time and that it is now several years out of date.

Interannual variability measures the variation in water supply between years — fluctuations that can disrupt the continuous availability of water required for water, sanitation and hygiene (WASH) facilities and services.

In times of water scarcity, for example, households may reduce hygiene practices such as hand-washing and cleaning, or rely on poorly managed, unmanaged or contaminated water sources. Additionally, flush toilets and sewers may not operate properly. Periods of water scarcity also reduce river flows, levels of reservoirs and other water supply sources needed to maintain WASH services, and can lead to structural damage to water systems. For example, dry soils can create cracks in pipelines, canals and reservoirs that become entry points for pathogens, pesticides and other pollutants. Indeed, the frequency of waterborne and diarrheal diseases increases in households without access to sufficient water and WASH interventions.

On the other end of the spectrum, an influx of too much water can also result in damaged infrastructure, debris that can block drainage systems and contamination of surface waters.

Data from Aqueduct assessing the interannual variability of water supply of 209 countries over the 1979-2019 period reveals that, on average, global water supply is moderate, averaging a score of 2 (on a scale where 0 indicates stable, predictable supply year over year and 5 indicates highly unpredictable supply).

At the country level, the picture is quite stark: 24 countries score 3 or higher, indicating above average interannual variability, including five countries scoring 4 and four countries scoring 5. This highlights significant inequalities between and across countries.

7589: Countries that mention resilience-building measures in relation to WASH infrastructure and operations in their national climate commitments

Historical Data Methodology and Challenges:

Data was extracted from Climate Watch’s NDC Tracker using the following filters: Category: Adaptation; Sector: Water; Subsector: Water Infrastructure, Water Sanitation, Water Supply, and Water Management; Key term: resilience. Due to time and staffing constraints, we did not conduct an in-depth review of how the key term was used within these documents. This results in an important limitation to our methodology since “resilience” could have been mentioned in the introduction of an NDC section discussing the need to include resilience in WASH yet is not necessarily referring to the actual creation or implementation of an associated policy or plan.

By 2030, half of the world’s population is expected to live in water-stressed areas. This situation makes it paramount to address challenges in water, sanitation and hygiene (WASH) services, particularly in regions or with groups most vulnerable to increasing water-related hazards, including floods and droughts.

These challenges are compounded by global pressures such as climate change, population growth and rapid urbanization — all of which are projected to have significant impacts on WASH services worldwide. Water utility providers, even better-financed ones, are under increasing pressure to expand coverage, improve service quality and meet local needs, all while maintaining and updating existing water infrastructure.

Understanding whether nationally determined contributions (NDCs) — the climate plans countries submit to the U.N. — incorporate resilience into WASH infrastructure and operations matters because NDCs shape national climate finance, planning and accountability, and climate change directly threatens water systems.

Climate Watch’s NDC Tracker is a tool used to monitor the content and ambitions of a country’s climate actions under the Paris Agreement to help gauge whether the world is on track to meet the agreement’s climate goals. Currently, 16% of countries with NDCs mention resilience-building measures in their WASH infrastructure and operational plans. However, although the great majority of NDCs include adaptation priority areas, vulnerability and risk assessments, and support needs, adaptation goals within these documents could still be considerably more specific, measurable and actionable — an important limitation of this indicator. While National Adaptation Plans (NAPs) contain more detailed information on adaptation planning, only 76 countries have submitted one to date, resulting in a substantially smaller analytical sample compared with the 194 parties that have submitted an NDC. In addition, currently no global tool exists to sift through or track WASH-related dimensions within NAP documents.

7614: Financial sustainability of water utilities, as measured by the ratio of operating revenue to operating costs for water and sanitation utilities

Historical Data Methodology and Challenges:

The number of countries reporting annually was 44 in 2021, 50 in 2022, and 48 in 2023. Vietnam was identified as an outlier in 2025 and removed from the dataset. Data for each country is calculated as the average across all reporting utilities within that country, by year.

Many countries face water infrastructure challenges linked directly to systemic and insufficient financial sustainability. Chronic challenges include inadequate tariffs; high “nonrevenue” water due to leaks or illegal connections; inaccurate (or lack of) metering, billing and collection; and heavy reliance on government subsidies that do not always cover operating costs. Utilities’ revenue models typically do not consider the true full cost of water provision that includes the cost of protecting ecosystem services and the broader watershed.

At the same time, weak governance — inconsistent policies, insufficient coordination among diverse stakeholders, and lack of context-specific strategies that balance both equity considerations and cost recovery — remains a key barrier.

All these issues compromise service continuity, water quality and equitable access to water, sanitation and hygiene (WASH) services and behaviors, particularly for vulnerable populations. Population growth and the climate crisis are placing even more pressure on water systems and the watersheds they rely on, making it even more essential to measure and ensure utilities’ financial sustainability in planning and adapting to these changes so that WASH services remain accessible and safe to all. At the same time household affordability is a major barrier to accessing water for WASH.

Data from about 70 countries was identified for this indicator. Ideally, more comprehensive global data would exist to measure the extent to which a utility’s revenues are able to cover its operating costs, reflecting its ability to maintain safe, reliable and continuous water and sanitation services. Financially sustainable utilities can maintain infrastructure, reduce service interruptions, invest in expansions and respond to emergencies — all of which are essential for achieving the U.N. Sustainable Development Goal targets.

7652: Inability to maintain aging water infrastructure, as measured by non-revenue water performance metrics for water and sanitation utilities

Historical Data Methodology and Challenges:

The current International Benchmarking Network for Water and Sanitation Utilities (IBNET) platform reports data from approximately 2,800 utilities in 152 countries. We did not include the 2022 value because it was unusually high and may contain discrepancies, or the 2025 value because the available data appeared to be incomplete.

All countries are facing a growing funding gap in keeping up with the rehabilitation, operation and maintenance of aging water infrastructures. Chronic underinvestment contributes to infrastructure deterioration, which in turn increases losses and maintenance needs even further. Water network performance metrics help reflect the physical condition and maintenance levels of distribution systems. They include metrics such as nonrevenue water (NRW, water that enters the distribution system but does not generate any revenue for the utility because it is lost in transit or not billed), pipe break rates, pipe leakage rates and service continuity.

Currently, no single global dataset exists to measure countries’ abilities to maintain their aging water infrastructure, so proxy metrics are often used instead. One such metric is nonrevenue water, which can reflect infrastructure that is not well-maintained or is aging. High levels of NRW lead to revenue losses that constrain utilities’ investment in system maintenance and upgrades, ultimately affecting the quality and reliability of water services for water, sanitation and hygiene (WASH). Most utilities fail to fully recover their basic operation and maintenance costs, especially when serving low-income households with low water consumption.

Many large water networks use infrastructure constructed decades ago that is beyond its intended design life and in need of repair and rehabilitation. These deteriorating conditions increase the risks of service disruptions due to damaged and leaky pipes and make it more difficult for water utilities to keep up with current and future demand. Aging distribution systems can also compromise water quality, increasing risks from corrosion, contamination intrusion and, in parts of North America and Europe, lead contamination from legacy lead service lines.

Data covering 152 countries sourced from Intelligent Utilities shows that, despite a small improvement in 2022, the world has made little meaningful progress in curbing water losses across distribution networks. Global NRW was 15 liters per connection per hour in 2021, but by 2024 it had climbed to 26 liters per connection per hour. Higher numbers signal that more water is being lost before it reaches paying customers, resulting in mounting financial losses for utilities, more leaks and pipe bursts, and wasted energy to treat and pump water that never reaches its destination. At a time when water scarcity is intensifying globally, the trend is moving in precisely the wrong direction.

7609: Amount of water- and sanitation-related official development assistance that is part of a government-coordinated spending plan

Historical Data Methodology and Challenges:

The “amount of water- and sanitation-related official development assistance that is part of a government-coordinated spending plan” indicator is derived from data collated through the UN-Water Global Analysis and Assessment of Sanitation and Drinking Water (GLAAS) survey, led by the World Health Organization (WHO), and activity-level ODA flows collected by the OECD and its Creditor Reporting System (CRS). A limitation of the nature of this indicator is that the indicator and the dataset being used tracks water and sanitation but not hygiene, which should also be measured for a full picture of ODA devoted to the WASH sector.

The indicator is maintained and managed by the WHO and OECD and made available through the WHO website. National governments complete the GLAAS Survey using multistakeholder input, with submissions validated through iterative feedback with counterparts in the region. The OECD breaks down water and sanitation ODA into several categories, including infrastructure, resource protection, and education, among others. These categories do not directly align with the SDG Target 6 but do collectively cover most water sector-related ODA. Furthermore, inconsistencies between budgeted ODA data available through the UN-Water GLAAS Survey and total national ODA collected through OECD CRS may exist. The impact of this is mediated to a degree by the sharing of OECD project-level ODA data with the GLAAS Survey, but this does not address all inconsistencies. Further information and metadata for the indicator is available here.

Finance is a critical barrier for water, sanitation and hygiene (WASH) services because investments in this sector are expensive, requiring long-term maintenance and operational funding. Most countries lack sufficient financing to implement national WASH plans, with many utilities and governments facing high debt burdens, limited fiscal resources and competing priorities.

Water and sanitation-related Official Development Assistance (ODA) reflects a financial measure of international cooperation and capacity development support for the improvement of water and sanitation at the national level. ODA is official financing from donor government agencies; the most common types of financial instruments are grants, concessional loans, technical assistance and debt relief.

Measuring the amount of water- and sanitation-related ODA within government-coordinated spending plans does not show whether this funding matches what recipient governments actually budget for water and sanitation, or whether donors are aligned with national priorities. However, it does highlight total water and sanitation ODA disbursements to countries over time.

Total global water- and sanitation-related ODA within government-coordinated spending plans increased from $7.5 billion in 2010 to $8.7 billion in 2023, peaking in 2018 with $10 billion disbursed globally. Since 2018, annual ODA commitments (as well as the finance received by governments from ODA) for water and sanitation development have largely been decreasing, a concerning trend that will need to be reversed if the world is to achieve universal access to reliable, affordable clean drinking water and safe sanitation services.

While increasing ODA can help address water and sanitation challenges, it is not a universal solution, as donor financing often comes with conditions (e.g., high interest rates or onerous requirements) that may not align with a nation’s specific water and sanitation needs, and governance constraints that can limit long-term sustainability.

In fact, a World Health Organization and U.N. Water 2021-2022 survey of 74 countries revealed that almost half of low-income countries receiving donor funds reported poor alignment between donor funds and national water sector plans. This highlights the need to increase domestic and public financing mechanisms to sustainably fund WASH services and infrastructure through water pricing or other measures focused on equitably raising revenues.

7593: Household affordability of water and sanitation services, as measured by the share of household income spent on these services

Affordability often determines whether people can access and sustainably use all water, sanitation and hygiene (WASH) services without sacrificing other basic needs like health care, food and education. Although global human rights to water and sanitation place obligations on countries to ensure that services are affordable, currently there is no universal definition of or way to measure affordability.

Nevertheless, World Health Organization (WHO) guidelines state that spending more than 3-5% of household income on WASH is unaffordable — a reality for many households living in poverty in low-income countries. Higher costs for these services disproportionally affect lower-income households, can deepen inequalities, and can mean that services go underused even when these are available — for example, when toilets exist but require payment.

Less than one-third of countries have established national monitoring indicators for affordability and equity related to U.N. Sustainable Development Goal Target 6.1 (centered on safe and affordable drinking water), and no countries have indicators for Target 6.2, which focuses on sanitation and hygiene. Some countries have established national affordability thresholds based on percentage of household income spent on WASH; Laos, for example, suggests that monthly water bills for low-income households not exceed 5% of their total monthly household income.

While different global and national proposed thresholds exist for what constitutes “affordability” of WASH services, very little data actually tracks affordability at the household level. Monitoring progress made in ensuring that all households can afford WASH services therefore remains limited.

A 2024 survey by the WHO found that 44 of 98 countries reported having a national target for drinking water affordability, and 34 of 72 have national indicators for affordability, yet few countries monitor progress against these targets or allocate resources to doing so. Recognizing these monitoring gaps, a UNICEF and WHO report recommends strengthening datasets and data analyses of income and expenditure surveys, as well as reaching a consensus on a threshold or range for affordable WASH services.

7567: Participation by Indigenous Peoples, Afro-descendant Peoples and local communities in water resources planning and management, as measured by countries with high community participation in water programs

Historical Data Methodology and Challenges:

The data is based on Sustainable Development Goal (SDG) indicator 6.b.1, which measures participation in  water resources planning and management programs in a country. Each country is assigned a score reflecting its level of participation: 3 for high participation; 2 for moderate participation; and 1 for low participation. Only countries with a score of 3 were considered in calculating the share of countries with high levels of participation. The number of countries with available data used as the denominator was 69 in 2017, 94 in 2019, and 107 in 2021.

Community engagement increases accountability, ownership and the long-term success of water, sanitation and hygiene (WASH) practices and infrastructure, leading to better service availability and human health. Facilitating meaningful engagement of underserved and marginalized groups in the design, implementation and adaptation of these practices ensures that solutions are culturally acceptable and meet the expressed needs and preferences of diverse cultural groups.

It is also crucial that WASH interventions integrate Indigenous knowledge and traditional practices — information that has historically and routinely been undermined by dominant water governance systems. A locally led approach — in which local groups are not just consulted but hold genuine decision-making power — can lead to even stronger and more sustainable outcomes. For example, in the Ecuadorian Amazon, the ClearWater project involved close collaboration with local communities, acknowledging their spiritual connection to water and involving them in every stage of planning and implementation. The initiative integrated traditional knowledge of rainwater harvesting and natural filtration systems, as well as local knowledge of pathogen exposure and waterborne infectious diseases. Over seven years, the project served more than 6,000 people; in a post project evaluation, 85% of the installed domestic rainwater harvesting systems had ideal water quality and 86% of people reported improved digestive health.

While there is no global indicator monitoring the degree of participation and leadership of Indigenous Peoples, Afro-descendant Peoples and local communities in water planning and management and WASH initiatives, Indicator 6.b.1 of the U.N. Sustainable Development Goals may provide a proxy measure. This indicator highlights the degree to which users and communities are actively participating in water resources planning and management at the national level; it includes information about whether laws and policies promote participation by service users and communities, and the level of their participation, disaggregated by sector (drinking water, sanitation, hygiene promotion and water resources planning and management).

In 2017, only 10% of reporting countries disclosed high levels of participation of users and communities in planning programs in water resources and management, yet by 2021 this figure had increased to nearly one-third of all reporting countries. While this trend is promising, local communities often question these reported figures, citing discrepancies between formal reporting and lived experiences, and the real quality, breadth and depth of community engagement on decisions and planning. In many cases, superficial community engagement can fail to genuinely engage all subgroups or be undermined by preexisting power relations.

7582: Countries with high community participation in water and sanitation management

Historical Data Methodology and Challenges:

Country-level participation score is sourced from UNSDG’s indicator 6.b.1 database from UN Water. The indicator is filtered by Water > Stakeholder participation > 6.b.1 Participation of local communities in water and sanitation management > Level of participation by communities and other users in the following sectors: Drinking Water, Sanitation, Hygiene Promotion and Water Resources planning and management. Countries that reported a “high level [of] participation” (i.e., a score of 3 at the national level for each sector) are selected to calculate the proportion of countries with a high level of participation by communities and other users. For sectors like Sanitation and Hygiene Promotion, where national level scores were unavailable, rural and urban level scores are used to derive a national level equivalent score. Only countries with a score of 3 in both rural and urban settings are considered to have clearly defined policies at the national level for these sectors. Countries and territories included in the study: 87 in 2014, 78 in 2017, 108 in 2019 and 113 in 2021. The total is then divided by the 210 countries on Systems Change Lab’s supported country list to calculate the reported proportion.

Engaging stakeholders at multiple levels is crucial to empower those disproportionately affected by poor freshwater quality, enabling them to improve their access to clean water while being valued participants in the process of making decisions and finding solutions. 

Centering communities and local stakeholders in the regular decision-making regarding water and its management can ensure more equitable and sustainable outcomes. Establishing clear procedures in policy for the engagement of local communities is vital to address the diverse needs of communities, particularly the needs of those most vulnerable. In addition, leadership and effective engagement by local communities in water and sanitation management fosters ownership that enhances the effectiveness of such schemes.

A low share of countries with high levels of participation by users or communities in water and sanitation management implies limited participation of local communities in water and sanitation management. Conversely, a high value would indicate extensive engagement, reflecting stronger ownership and a greater probability of achieving sustainable delivery and management of water and sanitation services.

Between 2017 and 2021, the most recent years for which data is available, the proportion of countries with high levels of user and community participation in water and sanitation management has increased from roughly 3% and 2%, respectively, to 14% and 12%. The most notable rise has been in hygiene promotion, which grew from 3.3% of countries in 2017 to 20% in 2021. That same year, 17% of countries reported high community involvement in water resources planning and management, up from 3% in 2017.

While these positive trends are encouraging, it also underscores that fewer than one in five countries have high levels of participation by users and communities, a gap that must be addressed to ensure equitable and sustainable water and sanitation management.

7568: Countries legally recognizing community-based water tenure rights to access and use water

Historical Data Methodology and Challenges:

The data for this indicator is sourced from the Rights and Resources Initiative  and the Environmental Law Institute’s “Whose Water?” report. This report uses a freshwater tenure methodology that captures the legal entitlements most essential for securing community-based freshwater tenure. This report only analyses the legal framework of 15 countries, which is a current challenge to our methodology.

Water tenure rights define how people can access, use, manage and make decisions about water resources, including the rights to access information on water resources and participate in decisions on water resources management. These rights can help improve their access to safe drinking water and sanitation services, support more efficient and sustainable water allocations for household, sanitation and hygiene needs, and encourage investment in water, sanitation and hygiene (WASH) infrastructure and services in both rural and urban communities.

By contrast, threats to communal waters held by Indigenous Peoples, Afro-descendant Peoples and local communities can undermine water-based livelihoods and deepen water insecurity among already marginalized communities, potentially limiting access to safe water for drinking, sanitation and hygiene.

Indigenous Peoples in Latin America, for example, are already 10-15% less likely to have access to piped water than the non-Indigenous population. Recognizing and establishing secure water rights for these communities is therefore critical to protect their human and territorial rights and support sustainable, community-led WASH and water resource management. 

Adapting from the Rights and Resources Initiative (RRI) land and forest tenure methodology, the RRI and the Environmental Law Institute developed a framework that defines community-based water tenure regimes as systems in which a local community has legally recognized rights to use and manage a freshwater resource and decide who is allowed to use it. Examples include the right to manage the rivers and lakes in their region, or to set up and control small-scale irrigation systems stemming from communal freshwater sources.

In their report “Whose Water?” these partners identified 39 community-based water tenure regimes  across 15 countries, providing a baseline for tracking legal recognition of community freshwater rights. The report also evaluated these regimes based on their ability to support community survival, culture, livelihoods and development — particularly for Indigenous Peoples, Afro-descendant Peoples and local communities.

While the report finds that rights to use and govern freshwater exist in 14 of the 15 countries assessed, significant legislative gaps and administrative barriers continue to limit communities’ ability to effectively manage and protect their freshwater resources. Data for more countries is also needed to more comprehensively assess global trends.

7563: Countries with high and very high levels of implementation of national-level integrated water resources management policies and plans

Historical Data Methodology and Challenges:

We used data from SDG 6.5.1 (Status of implementation) and counted countries that are classified as having high or very high levels of implementation. The denominator consisted of 193 countries in 2017 and 2020, and 194 countries in 2023.

Complex freshwater governance where government agencies, Indigenous governments, community groups, nongovernmental organizations and private actors share overlapping authority can lead to coordination challenges when handling shared problems such as those presented by water, sanitation and hygiene (WASH). The transboundary nature of many freshwater ecosystems may further complicate access to safe water when transboundary cooperation plans are not in place.

Integrated water resources management (IWRM) in the WASH context promotes the cross-body coordinated planning and management of water, land and related resources to ensure that all communities have reliable access to safe WASH services while maintaining ecosystem health. Effective IWRM promotes water security by conserving water-dependent ecosystems and maintaining water quality while also reducing pollution and safeguarding drinking water by minimizing contamination from agriculture, industry and urban runoff. It also integrates climate change considerations into water management strategies, helping to adapt to changing precipitation patterns, extreme weather events and rising temperatures — all factors that can affect the continuity of WASH services.

IWRM implementation has resulted in significant and diverse benefits in multiple countries and regions, many of which directly support WASH outcomes. For example, in Denmark it has led to improved groundwater quality and enhanced protection of drinking water sources. India has seen improvements in rural livelihoods and downstream water quality preservation. Bangladesh experienced poverty reduction alongside the restoration of vital wetland ecosystems, which promotes cleaner water and improved flood regulation. And Minzir, in northern Ethiopia, revived local water supplies in a previously barren landscape.

Globally, the share of countries with high or very high levels of implementation of national-level IWRM policies and plans grew from 19% in 2017 to 26% in 2023. While this is trending upward, as of 2023, 136 countries still had not made sufficient progress with IWRM implementation, despite the global call for IWRM since 1992. The limited implementation of such policies hinders sustainable water management, reducing the reliability and safety of WASH services while increasing the potential for conflicts, resource inefficiencies and service interruptions.

7574: Stronger regulatory enforcement, as measured by the share of countries scoring relatively highly on regulatory enforcement

Historical Data Methodology and Challenges:

The World Justice Project (WJP) Rule of Law Index measures the extent to which legal and administrative regulations are effectively and fairly implemented and enforced. It examines whether regulatory enforcement is subject to improper influence, administrative proceedings are conducted without unreasonable delays, due process is respected within these proceedings, and governments respect property rights. A key limitation of relying on this data is that these facets of regulatory enforcement can all impact the freshwater sector, but the data do not specifically measure effective enforcement of freshwater sector regulations. Rather, this data assess overall regulatory enforcement, which can vary among sectors within the same country. Countries that scored over >0.6 on a scale of 0.0 (lowest) to 1.0 (highest) were included in the selection criteria as indicative of countries that have relatively high levels of regulatory enforcement. This threshold was determined jointly via expert judgement by Systems Change Lab and WJP researchers. Finally, data are available beginning in 2012, but to maintain a more consistent country sample, we present data from 2021 onwards. Still, the number of countries included in each year of data varied: 139 countries in 2021, 140 countries in 2022, 142 countries in 2023 and 2024, and 143 countries in 2025. So, the numerator reflects the number of countries that scored >0.6, while the denominator includes all countries with scores in a given year.

Insufficient resources and weak institutional capacity often impede governments that have established strong WASH policies on paper from enforcing them in practice. Measuring government capacity, however, can be quite difficult — for example, it encompasses mechanisms for coordinating across ministries and at different scales of government, leadership structures, processes for allocating funds to local levels, and institutional incentives needed to deliver water management strategies.

These dimensions of institutional capacity are central to the governance and implementation of water, sanitation and hygiene (WASH) systems, which require effective coordination, regulation and accountability between government agencies, utility and service provers, and communities. Weaknesses in institutional arrangements and limited enforcement capacity are widely discussed as major drivers of WASH service delivery failures, particularly where accountability between governments and providers is fragmented or not well-resourced.

Here, we rely on aggregate scores focused on regulatory enforcement from the World Justice Project Rule of Law Index as a proxy to approximate government capacity. This index measures the extent to which legal and administrative regulations are effectively and fairly implemented and enforced, and examines whether regulatory enforcement is subject to improper influence, administrative proceedings are conducted without unreasonable delays, due process is respected within these proceedings, and governments respect property rights.

As of 2025, only 31% of 143 governments around the world boasted relatively high levels of regulatory enforcement, and this share has remained relatively stable. 

Other shift Other shifts needed to transform the system

Minimize disruptions to the timing and quantity of the water cycle

Amid disruptions from climate change, overconsumption of water in developed economies and land use change, safeguarding the water cycle is essential to ensuring a future where communities and ecosystems thrive.

Effectively halt conversion and degradation across freshwater ecosystems

Converting and degrading freshwater ecosystems undermines their ability to deliver critical services to people and nature. Effectively halting this destruction is crucial to prevent continued biodiversity loss, preserve climate mitigation benefits and support sustainable development for communities around the world.

Restore freshwater ecosystems

Restoring freshwater ecosystems is vital to limiting global warming, adapting to climate change and reversing biodiversity loss. Healthy rivers, lakes and wetlands — including salt marshes, mangroves and peatlands — are fundamental to planetary health and human well-being.

Sharply reduce water pollution and improve water quality

Freshwater quality is declining worldwide, reducing access to clean water and increasing pressure on biodiversity. Rapid action is needed to curb human activities driving water pollution and secure a long-term supply of clean water for all.

Halt the overexploitation of wild, freshwater species and ensure sustainable use

Freshwater species play vital roles in keeping water clean, cycling nutrients and underpinning human food systems. Yet they are disappearing at alarming rates — a crisis that threatens to unravel ecosystems, weaken the planet’s ability to provide clean water and undermine human well-being.