Photo by CHUTTERSNAP via Unsplash

The most cost-effective means of reducing transport emissions is to avoid the need for motorized travel, utilizing city planning to bring opportunities closer to residents and encouraging less carbon-intensive modes of movement, such as public transport, walking and cycling.

Historically, most transport systems have centered around private car ownership. This is the standard in high-income economies, and car ownership is increasing in some developing countries as people build wealth. Many regions lack viable alternatives to car ownership, and in some areas, the car is viewed as a status symbol. Where public transport has long been neglected, the resulting traffic congestion has been addressed by expanding highways and roads — but this is only a temporary solution until congestion returns due to induced demand.

Reducing the need for travel will make decarbonization easier and improve health outcomes. 

Without a fundamental shift in transport systems, there will be 2 billion cars on the road by 2050. By focusing on what makes people choose to drive in the first place, transport demand management can improve mobility and quality of life in a rapidly urbanizing world. 

The most cost-effective means of reducing transport emissions is to avoid the need for motorized travel, utilizing city planning to bring opportunities closer to residents and encouraging less carbon-intensive modes of movement, such as public transport, walking and cycling. 

Options for managing urban car use include planning for "15-minute cities,” improving quality and access to shared transport, and implementing charges for private vehicle use, such as congestion pricing. These approaches can reduce congestion and inner-city pollution, and funds raised from congestion and parking fees can be reinvested in public transit improvement projects, as seen in London.

Additionally, the COVID-19 pandemic revealed that telework for management, tech and administrative support jobs can reduce daily transport demand, just as moving conferences to digital platforms can reduce international business travel.

Electric car sharing offers an affordable, low-emission option. In some places, longer distance trips can be shifted to rail and maritime modes, especially journeys of three to four hours. 

Already, France has become the first large economy to ban short-haul flights where a train or bus alternative of 2.5 hours or less exists, effectively reducing emissions by eliminating 12% of domestic flights. Other countries, including all members of the European Union, are taxing commercial aviation and jet fuel in an effort to encourage fewer passengers and more energy-efficient planes.

Tracking progress on global outcomes

2240: Share of kilometers traveled by passenger cars

Status: Wrong Direction
Historical Data Methodology and Challenges:

The original data was sourced from The International Transport Forum (ITF), which publishes its flagship report biennially as part of the OECD Transport Outlook series.

Target Methodology:

We established targets from the International Transport Forum’s “All-Out Policy” Scenario (2025). This scenario represents an upper-bound estimate of technically feasible transport mitigation measures and assumes the following:

  • The share of zero-emission vehicles in light-duty vehicle sales reaches 100% by 2040.
  • The share of zero-emission vehicles in heavy-duty freight vehicle and non-urban bus sales reaches 30% by 2030 in China and OECD countries.
  • Aggressive internal combustion engine vehicle scrappage policies are implemented.
  • Widespread adoption of sustainable aviation fuel and zero-emissions shipping fuel takes place.
  • Significantly higher carbon pricing levels than present levels are enacted.

Total transport sector emissions in this scenario reach 2.6 GtCO2e in 2050, which falls within the interquartile range of 2050 transport emissions (2.2–3.6 GtCO2e) of the 24 1.5 degrees C-aligned scenarios described in Box 2 of the latest State of Climate Action technical note.

Progress Assessment Methodology:

Following methods outlined in our technical note, we excluded 2020 data from this indicator’s linear trendline given evidence that 2020 data constituted a temporary outlier in response to the COVID-19 pandemic. The linear trendline uses data points from 2015, 2019 and 2022, the only available such points within the last 10 years.

See our methodology page and the latest State of Climate Action for more information on our approach for assessing progress.

For the transport sector to play a role in limiting global temperature rise to 1.5 degrees C (2.7 degrees F), high-income countries — the top 10 of which contribute 53% of global transport emissions and have high rates of motorization — will have to reduce light-duty vehicle (LDV) travel. Developing economies will also need and have the opportunity to reduce or slow the growth of vehicle travel and create sustainable transport systems not dependent upon cars.

While there is no extensive historical data available on the share of trips made by passenger cars, the data that does exist shows a worrying trend. The global share of kilometers traveled by passenger cars increased from 39% in 2015 to 48% in 2019, and after a spike in 2020 likely due to the COVID-19 pandemic, returned to 48% in 2022.

The cause of this increase is understandable: as populations and gross domestic products (GDPs) have grown, so has the number of people who own automobiles, and therefore the share of trips made by privately-owned cars.

The trend in car ownership is expected to accelerate in developing countries as GDPs continue to grow. Countries with the highest GDPs per capita are more culpable for the current state of this indicator. In those regions across Africa and Asia where transport demand is surging but private vehicle ownership is not yet widespread, there is a pressing need and a timely opportunity to invest in high-quality public transport and active mobility infrastructure to avoid defaulting to car-dependent development patterns.

In modeled pathways that limit warming to 1.5 degrees C, the share of kilometers traveled by passenger cars falls to 45% by 2030, 43% by 2035 and 40% by 2050.

Research shows that in the most congested cities in the United States, 48% of all car trips are less than three miles (4.8 kilometers) in length, and 20% are shorter than one mile (1.6 kilometers). Walking, e-scooters and bikes could replace a significant portion of short trips, as could inclusive, accessible public transit for medium-length trips.

Given that travel behavior is heavily influenced by infrastructure and the availability of convenient, affordable and safe transportation options, it is the responsibility of policymakers to create an environment where sustainable alternatives are convenient and more attractive than private motor vehicles.

2241: Share of trips 1,000 km or further by mode

Status: Insufficient Data

With more people able to afford air travel, the demand for global passenger aviation is expected to grow three-fold globally between 2020 and 2050, with 60% of that growth in emerging markets and developing economies. 

Although aviation is the only practical option for intercontinental travel, rail, bus and electric car sharing are viable modes for many long-distance trips. 

The opportunity to shift to high-speed rail varies by geography, but in 2019 it was estimated that about 15% of regional flights could be shifted to existing rail.

There is currently no publicly available global data on the share of long-distance trips by mode. This information would need to be compiled by institutions with access to multinational data and high international trust, such as the International Energy Agency or the International Transport Forum. This data would help inform policymakers about how people choose to travel long distances and how smart decisions can be made to decarbonize long-distance travel.

Key enablers and barriers to change

2158: Passenger rail activity

Historical Data Methodology and Challenges:

Data is available in BNEF's New Energy Outlook, but it is behind a paywall.

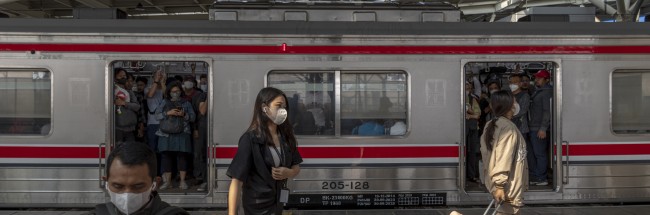
Rail can connect people to economic, educational and social activities more safely and quickly than other modes of transport, and it can run on 100% electric power. Three-quarters of passenger rail trips already take place on electric trains. Rail is also energy efficient: while the rail sector carries 8% of the world’s passengers and 9% of global freight transport, it represents only 2% of transport energy consumption.

Currently, passenger rail networks are concentrated in a few regions — China, the European Union, India, Japan and Russia — that together account for 90% of global passenger rail activity.

In 2005, passengers traveled 2.38 trillion passenger-kilometers (pkm) by rail. By 2019, this rose to 3.94 trillion pkm. The vast majority of this growth occurred in China, where high-speed rail has expanded by 25,000 km in the last decade — more than the rest of the world combined — and passenger traffic has increased to 1.7 billion passengers a year. 

2159: Rail network length

Historical Data Methodology and Challenges:

Rail network length by country was calculated by dividing the total rail length from the World Bank by the total population data from the World Bank for each country. For the global per capita, the sum of rail length was divided by the sum of population of countries that have rail length data.

Rising incomes and populations in developing and emerging economies are set to lead to stronger demand for more efficient, faster and cleaner transportation. Many developing nations have an opportunity to grow their economies with rail, investing early and reaping the benefits of a clean, efficient and affordable means of transport for both people and freight.  

Rail systems are most cost and energy-efficient at full capacity, so strategic planning and implementation of new rail networks along the highest-traffic routes will maximize their low-emission and congestion-alleviation benefits. In 1995, there were 152 kilometers (km) of rail for every million people around the world. Since then, the coverage of rail networks per capita has been declining, as the pace at which new rails are being built has not kept up with population change. 

China has emerged as a global leader in high-speed rail infrastructure, with plans to double its high-speed rail network over the next 15 years and expand access to all cities with populations over 200,000. The more cities that are connected, the greater value rail will have, providing long-term economic, environmental and social benefits for citizens.

Other shift Other shifts needed to transform the system

Guarantee reliable access to safe and modern mobility

All people deserve access to opportunities via safe transport and convenient mobility options. The transition of the world’s energy systems to decarbonized travel modes must be accomplished equitably in a way that enhances access to opportunity for everyone.

Shift to public, shared and non-motorized transport

Achieving a sustainable, low-carbon transport system demands a comprehensive approach: avoiding unnecessary trips, shifting travel to more sustainable modes, improving transport technology and increasing access to jobs and opportunities.

Transition to zero-carbon cars, trucks and buses

Global greenhouse gas (GHG) emissions from passenger cars, trucks and buses made up about three-quarters of total transport emissions in 2023, underlining the importance of a rapid transition away from fossil fueled-powered vehicles.

Transition to zero-carbon shipping and aviation

Although both shipping and aviation are seen as “hard-to-decarbonize,” both sectors have pathways to a greener future. Decarbonizing shipping and aviation will require a combination of technological solutions, such as zero-emission fuels and batteries, alongside operational and efficiency improvements.