Photo by Ivan Radic via Flickr

Global greenhouse gas (GHG) emissions from passenger cars, trucks and buses made up about three-quarters of total transport emissions in 2023, underlining the importance of a rapid transition away from fossil fueled-powered vehicles.

Passenger cars are on the way to decarbonization, but they need a push to keep us on track for a 1.5 degrees C world.

The world is in the midst of a transformation in motor vehicles, with sales of electric vehicles (EVs) making up more than one in five car sales globally in 2024. Continuously falling vehicle and battery costs, improvements in battery performance, and the growing availability of charging infrastructure have made EVs mainstream, especially in China, where one in two cars sold are electric. As this transformation continues, it will have broad ramifications for the global automobile industry and global transport sector emissions. Still, there remains a gap to reach 75% to 95% by 2030, the range compatible with limiting warming to 1.5 degrees C (2.7 degrees F).
 

Progress on zero-emission trucks and buses needs a jolt, especially outside of China and Europe.

Progress on decarbonizing truck transport is not as advanced as it is with passenger cars, but there are promising signs. Several electric heavy-duty truck models are already commercially available or in an advanced stage of development, and electric medium-duty vehicles are starting to be rolled out in many corporate fleets.

Long-haul, heavy-duty trucks will be the most challenging class to decarbonize. Battery energy density for these models is currently a limiting factor, and recharge times affect corporate profitability. However, the newest trucks can travel 300 kilometers (km) on a single charge, and additional battery technology improvements are estimated to enable a 40 tonne truck to drive 400 km on a single charge by 2025, suggesting that there could be rapid technological change in even the heaviest vehicles.

Though hydrogen fuel cell models do not share the energy density challenges faced by battery electric models, they are still in the early stages of development and renewable hydrogen continues to be prohibitively expensive. In addition, hydrogen as a transport fuel must contend with the significant efficiency losses incurred through the production and transportation process — losses that are not a factor for battery electric models. Progress will require investments in hydrogen supply chains in addition to refueling infrastructure.

Progress on decarbonizing buses remains extremely uneven, with very high sales in China pushing the global sales share of electric models up significantly. A few European countries have also invested in electric buses. In the rest of the world, electric buses have yet to make large inroads.

Tracking progress on global outcomes

2255: Displaced internal combustion engine workers who regained employment

Status: Insufficient Data

As zero-emission vehicles gain market share and internal combustion engine (ICE) vehicle production declines, workers specializing in internal combustion engines will need to reorient their skills to electric vehicle (EV) components and batteries or to other areas of the economy.

A report on the future of the industry in the European Union (EU) estimates that retraining will be needed for around 2.4 million workers. About 1.6 million of these will remain at their current places of employment, with some changes. Around 610,000 workers will remain in the industry but in slightly different roles or companies, and 225,000 workers will need training for entirely different roles and need to be relocated to new jobs and companies.

There is currently no publicly available data on the percent of workers who have shifted from ICE vehicle production to other jobs in the EV industry or the wider economy, nor is there a quantitative target for 2030 or 2050. As ICE vehicles still dominate global sales and fleets, it is reasonable to expect the job shift to be quite small at this point. However, a just transition requires efforts to promote training and requalification so that workers in the auto industry remain gainfully employed, albeit likely with new jobs or in new industries.

2256: Battery electric, plug-in hybrid and fuel cell electric vehicles in light-duty vehicle sales

Status: Off Track
Historical Data Methodology and Challenges:

To calculate electric vehicle (EV) sales for light-duty commercial vehicles, we divided annual BEV, PHEV and FCEV cars sales by the total EV sales share.

Target Methodology:

Targets were derived from the Climate Action Tracker (CAT) consortium’s 2020 paper, Paris Agreement Sectoral Benchmarks: Methods Report. These targets were compared with other targets in the literature from sources such as IEA 2021, IRENA 2021 and ICCT 2020. These targets were chosen because they represent the high-end of ambition within 1.5 degrees C (2.7 degrees F)-compliant pathways. The CAT team first considered integrated assessment models (IAMs) that were able to limit warming to 1.5 degrees C (“no overshoot” and “low overshoot” scenarios in which a brief and limited overshoot of average warming occurred). They refined their selection to include only those scenarios that assumed sustainable use of carbon removal and use of biomass. These pathways are defined on a least-cost pathway and do not consider equitable distribution of costs and required action. Finally, the CAT team also used a combination of its own bottom-up modeling (e.g., for electric vehicles) and other independent literature to ensure a complete representation of the literature was considered. Each sectoral target that was derived from such bottom-up analyses was still compared with 1.5 degrees C-compatible IAMs to ensure that, if there were any discrepancy, it would be at least as ambitious as the IAM targets (and therefore 1.5 degrees C-compatible).

S-Curve Trajectory:

Changes are based on the adoption of an innovative technology. These types of technologies often follow an S-curve trajectory in their adoption if they are successful, although this is not guaranteed.

Progress Assessment Methodology:

For indicators categorized as S-curve likely, acceleration factors calculated using a linear trendline are not presented, as they would not accurately reflect an S-curve trajectory. The category of progress was determined based on author judgment, using multiple lines of evidence. More specifically, given that this indicator is in the breakthrough stage of an S-curve, our current trend arrow is an S-curve fit to the historical data. Our assessment of progress was made based on this extrapolation, as well as a review of the literature and consultations with experts.

See our methodology page and the latest State of Climate Action for more information on our approach for assessing progress.

The share of electric vehicles (EVs) in global light-duty vehicle (LDV) sales has taken off, growing from just 4% in 2020 to 22% in 2024. This represents over 17 million electric cars sold.

This rapid, nonlinear growth — together with continuously falling vehicle and battery costs, improvements in battery performance, and the growing availability of charging infrastructure — suggests that light-duty electric vehicle sales are in the diffusion stage of an S-curve growth trajectory. However, the growth of EVs as a share of LDV sales was slightly less rapid in 2023 (20% growth) and 2024 (22% growth) compared to prior years. More progress will be needed for EVs to reach 75% to 95% of LDV sales by 2030.

Sales are not even across all geographies. China maintained its global lead, with EVs accounting for almost 50% of its car sales in 2024, while the European Union saw a 20% share and the United States saw a 10% share. In many other countries, sales remain low. To avoid a two-tiered global market, it is important that developed markets and development banks provide assistance to developing countries to grow their EV markets and charging infrastructure.

2257: Battery electric, plug-in hybrid and fuel cell electric vehicles in the light-duty vehicle fleet

Status: Off Track
Historical Data Methodology and Challenges:

To calculate electric vehicle (EV) stocks for light-duty vehicles, we divided annual BEV, PHEV and FCEV cars stocks by the total EV stocks share.

Target Methodology:

Targets were derived from the Climate Action Tracker (CAT) consortium’s 2020 paper, Paris Agreement Sectoral Benchmarks: Methods Report. These targets were compared with other targets in the literature from sources such as IEA 2021, IRENA 2021 and ICCT 2020. These targets were chosen because they represent the high-end of ambition within 1.5 degrees C (2.7 degrees F)-compliant pathways. The CAT team first considered integrated assessment models (IAMs) that were able to limit warming to 1.5 degrees C (“no overshoot” and “low overshoot” scenarios in which a brief and limited overshoot of average warming occurred). They refined their selection to include only those scenarios that assumed sustainable use of carbon removal and use of biomass. These pathways are defined on a least-cost pathway and do not consider equitable distribution of costs and required action. Finally, the CAT team also used a combination of its own bottom-up modeling (e.g., for electric vehicles) and other independent literature to ensure a complete representation of the literature was considered. Each sectoral target that was derived from such bottom-up analyses was still compared with 1.5 degrees C-compatible IAMs to ensure that, if there were any discrepancy, it would be at least as ambitious as the IAM targets (and therefore 1.5 degrees C-compatible).

S-Curve Trajectory:

Changes are based on the adoption of an innovative technology. These types of technologies often follow an S-curve trajectory in their adoption if they are successful, although this is not guaranteed.

Progress Assessment Methodology:

For indicators categorized as S-curve likely, acceleration factors calculated using a linear trendline are not presented, as they would not accurately reflect an S-curve trajectory. Our current trend arrow is based on an S-curve fit to the historical data, but such an extrapolation is highly uncertain when an indicator is in the emergence stage of an S-curve and is included for illustrative purposes only. Our categorization of progress for this indicator is based on a review of the literature and consultations with experts.

See our methodology page and the latest State of Climate Action for more information on our approach for assessing progress.

While measuring electric vehicle (EV) sales is important to understanding how EV adoption has grown, the ultimate measure of how well EVs have displaced their fossil fuel-powered counterparts is the share of EVs among cars on the road. The share of EVs in the total light-duty vehicle (LDV) fleet depends on both new car sales and turnover of older internal combustion cars.

Rapidly growing sales volumes in key markets such as China, the European Union and the United States have led to greater overall EV numbers, with total EV numbers globally rising from a little under 1 million on the road in 2015, to 58 million on the road in 2024. Still, the actual share of EVs is quite low, at just 4.5% in 2024. Continued exponential change will be needed to reach 25%-40% by 2030, 55%-65% by 2035, 75%-90% by 2040 and 95%-100% by 2050.

Rapid growth in EV sales suggests a forthcoming breakthrough in EVs as a share of the LDV fleet, and that growth of the electric LDV fleet along an S-curve is likely. But, with the share of EVs in LDV sales off track, and no compelling evidence that stock turnover will occur quickly enough, the share of EVs in the LDV fleet is also off track. To get on track for 2030, both sales and turnover will need to grow rapidly this decade.

1922: Electric vehicles in two- and three-wheeler sales

Status: Off Track
Target Methodology:

This target was taken directly from the IEA net-zero emissions scenario.

S-Curve Trajectory:

Changes are based on the adoption of an innovative technology. These types of technologies often follow an S-curve trajectory in their adoption if they are successful, although this is not guaranteed.

Progress Assessment Methodology:

For indicators categorized as S-curve likely, acceleration factors calculated using a linear trendline are not presented, as they would not accurately reflect an S-curve trajectory. More specifically, we do not have sufficient historical data to fit an S-curve to the data, so our current trend is based on the linear trendline from the past five years. This is appropriate because two- and three-wheeler sales are in the diffusion stage of an S-curve, during which growth usually follows an approximately linear path. Our assessment of progress is based on the trajectory of the S-curve, a review of the literature, and expert judgment. 

See our methodology page and the State of Climate Action 2023 for more information on our approach for assessing progress.

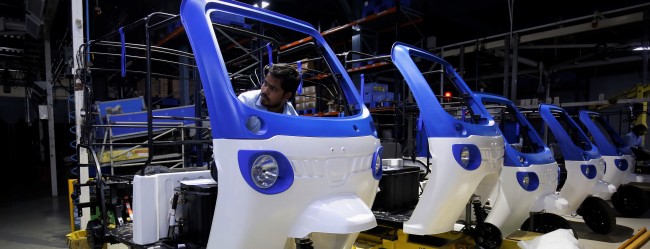
Electrification of two- and three-wheelers is already underway and shares that are electric are substantially higher than those in cars, vans and trucks. The share of electric vehicles (EVs) in two- and three-wheeler sales increased from 36% in 2019 to 49% in 2022.

Electric two- and three-wheelers are the types of innovative technologies that generally follow an S-curve. But sales of electric two- and three-wheelers are in a later stage of an S-curve, during which further acceleration is less likely. Indeed, the best fit for the past five years of data for this indicator is a linear trendline. 

For this reason, we assess progress taking into account the linear trendline, which shows that the indicator is making promising progress but off track. This assessment is corroborated by BloombergNEF’s assessment of progress, which finds that electric two- and three-wheelers are almost but not yet on track for a net-zero emissions trajectory.

2258: Battery electric, plug-in hybrid and fuel cell electric vehicles in medium- and heavy-duty commercial vehicle sales

Status: Well Off Track
Historical Data Methodology and Challenges:

To calculate electric vehicle (EV) sales for medium- and heavy-duty commercial vehicles, we divided annual BEV, PHEV and FCEV trucks sales by the total EV sales share.

Target Methodology:

This target was taken directly from the IEA net-zero emissions scenario.

S-Curve Trajectory:

Changes are based on the adoption of an innovative technology. These types of technologies often follow an S-curve trajectory in their adoption if they are successful, although this is not guaranteed.

Progress Assessment Methodology:

For indicators categorized as S-curve likely, acceleration factors calculated using a linear trendline are not presented, as they would not accurately reflect an S-curve trajectory. The category of progress was determined based on author judgment, using multiple lines of evidence. More specifically, this indicator is categorized as well off track, because it is a new technology that is still in the emergence stage of an S-curve. The current trend arrow is based on an S-curve fit to the historical data, but such an extrapolation is highly uncertain when an indicator is in this early stage and is included for illustrative purposes only.

See our methodology page and the latest State of Climate Action for more information on our approach for assessing progress. 

Medium- and heavy-duty trucks contributed about 23% of global transport emissions in 2021. Greenhouse gas (GHG) emissions from heavy-duty vehicles (HDVs) are expected to taper off more slowly than those from light-duty vehicles (LDVs). This is mainly because most big trucks continue to use diesel fuel, as electrifying HDVs is more difficult than electrifying LDVs.

Moving large vehicles requires much more energy than small vehicles, and batteries must therefore be larger to supply this energy. Larger batteries are heavier, however, and there is a trade-off between the weight of the battery and the weight the truck can haul. In addition, long-haul trucks have different requirements for range and charging speed than passenger cars.

Increasing battery density is expected to alleviate some of these issues, and fuel cells are also considered to electrify heavy-duty transport due to their higher energy densities. However, due to these obstacles to electrification, global GHG emissions from the HDV fleet are projected to be larger than those of the LDV fleet by 2025.

Global sales of electric medium- and heavy-duty vehicles (MHDVs) rose to 1.8% of total sales by 2024. Nonetheless, they remain low relative to other categories and remain well off track. MHDVs are still in the emergence stage of an S-curve, and a dramatic change is required to reach the 2030 target of 37%.

2259: Battery electric, plug-in hybrid and fuel cell electric vehicles in bus sales

Status: Well Off Track
Historical Data Methodology and Challenges:

To calculate electric vehicle (EV) sales for buses, we divided annual BEV, PHEV and FCEV bus sales by the total EV sales share.

Target Methodology:

This target was taken directly from the IEA net-zero emissions scenario.

S-Curve Trajectory:

Changes are based on the adoption of an innovative technology. These types of technologies often follow an S-curve trajectory in their adoption if they are successful, although this is not guaranteed.

Progress Assessment Methodology:

For indicators categorized as S-curve likely, acceleration factors calculated using a linear trendline are not presented, as they would not accurately reflect an S-curve trajectory. This indicator appeared to approach the breakthrough stage of an S-curve in 2014-2018, but it has since stagnated. Therefore, we reverted to using a linear trendline for the current trend arrow rather than an S-curve extrapolation.

See our methodology page and the latest State of Climate Action for more information on our approach for assessing progress. 

Buses emitted about 6% of total carbon dioxide (CO2) emissions from transport in 2021. Switching to electric buses eliminates those emissions, as well as harmful tailpipe emissions such as fine particulate matter, black carbon and nitrogen dioxide (NO2).

Electric buses experienced a burst of rapid growth in the mid-2010s, with sales share increasing from just 0.6% in 2014 to 5.7% in 2018. This growth was driven primarily by progress in China. China’s government encouraged the development of an electric bus manufacturing ecosystem and subsidized initial electric bus purchases, and by 2018 two-thirds of buses sold were electric. A few European countries such as the Netherlands, Finland and Switzerland have also introduced large numbers of electric bus sales.

However, as the market for new buses in China has shrunk because so many were deployed in a short amount of time, and other major markets have failed to catch up, the global electric bus sales share has remained flat over the last five years and was still at 6% in 2024. Electric buses are currently well off track to reach the 1.5 degrees C-aligned target of 56% of bus sales by 2030.

Key enablers and barriers to change

2187: Jurisdictions with internal combustion engine phase-out targets

Setting a target year for phasing out internal combustion engine (ICE) vehicles is a vital policy measure for achieving road transport decarbonization. Globally, ICE vehicle sales should cease by 2035 at the latest to be 1.5 degrees C (2.7 degrees F) compatible; this implies that in developed countries, they should stop even earlier.

Having an ICE vehicle phase-out target date provides investment certainty to automakers, creating an incentive to speed their transition to zero-emission models. It also informs the decisions of consumers who are considering their next new car purchase, since the decline in ICE models’ resale value will compound as the phase-out date nears.

To ensure that the transport sector is rapidly decarbonized across all countries, it is also critical to address the issue of polluting used vehicles being exported from wealthy countries to meet the demand for vehicles in less wealthy countries. This can be done through regulation that bans such exports, though few developed countries have such regulation currently, or through import bans, which are in place in many less wealthy countries.

There were 22 jurisdictions with ICE phase-out targets in 2022, up from 18 in 2021. A few countries’ plans stand out. Norway, long a leader in electric vehicle (EV) sales, has a world-leading target of 2025 that it may now achieve by the end of 2022. Other national goals, like Spain’s 2040 target, miss the 2035 deadline and should be brought forward. This is already happening in many countries — Canada, for example, recently moved its deadline from 2040 to 2035.

2188: Countries with zero-emission vehicle sales mandates

Historical Data Methodology and Challenges:

Data was collected from the IEA policy tracker by selecting countries with national zero-emission electric vehicle (ZEV)-related policies.

Mandating that automakers sell a specific percentage of zero-emission vehicles (ZEVs) or generate a specific number of ZEV "credits" is a useful supply-side method of accelerating electric vehicle (EV) uptake.

The first ZEV mandate was adopted in California in 1990, well before ZEVs were readily available, with the intention of spurring innovation and ZEV manufacturing. It did not manage to spur the necessary cost and performance improvements in ZEVs during the initial phase and was subsequently weakened considerably, but it has seen greater success in recent years.

A Chinese version of this policy was implemented in 2018 — a point in time when federal purchase subsidies were starting to be rolled back, and after a robust local ZEV manufacturing industry had already been established. In the European Union, a voluntary scheme to encourage automakers to produce ZEVs was established in 2021 to complement and strengthen its updated carbon dioxide (CO2) emissions standards.

As of 2022, 46 countries and 1 region have ZEV sales mandates.

2189: Jurisdictions with financial incentives for zero-emission vehicles

While the upfront costs of purchasing zero-emission vehicles (ZEVs) remain higher than their fossil fuel counterparts, financial incentives can expedite their uptake. Many countries have used these to great effect.

Norway has had such incentives in place since the early 1990s, when the purchase/import tax was removed for electric vehicles (EVs), and deployed a cascade of further incentives over the following three decades. The result is an astonishing pace of transition, with Norway set to achieve 100% EV sales well before its world-leading 2025 target date, and as early as the end of 2022.

Not all countries have the resources available to provide such incentives, however. In this instance, alternative approaches to reducing road transport emissions should be considered with support from wealthier countries. This could include expanding the availability of public transport and electrifying existing public transport vehicles.

An additional approach that could help to fast-track this transition is the establishment of trade-in programs, which offer payments for trading in older, more polluting vehicle models for zero-emission alternatives.

2190: Public charging stations

Historical Data Methodology and Challenges:

Global and country-level data was collected from IEA’s Global EV Data Explorer by filtering for “EV charging points.”

A key precondition for the widespread deployment of electric vehicles (EVs) is a large and reliable charging infrastructure network. Although most EV charging takes place at home, publicly available charging infrastructure is necessary for longer distance travel.

The total number of public charging stations has increased substantially over the past decade, with the number of EV chargers more than quadrupling between 2020 and 2024 (1.3 million to 5.4 million).

Almost two-thirds of all installed chargers are found in China. 15% are in the European Union, 8% are in South Korea, and 3% are in the United States.

Particularly for longer distances, EV drivers want fast chargers that can deliver a charge of 80% or more power in less than 30 minutes. The share of fast chargers has been increasing more rapidly than that of regular chargers and reached 37% of all chargers in 2024, up from just 7% in 2017.

In total, there were around 2 million fast, and nearly 3.4 million slow, publicly available charging points in the world in 2024, making up 5.4 million in total.

2191: Jobs in electric vehicle manufacturing and supply chains

Workers from a variety of educational and employment backgrounds are employed in the electric vehicle (EV) industry — including scientists who conduct research in electric drive technology, manufacturing workers who build vehicles, and automotive maintenance technicians who repair vehicles. Most of these occupations require specialized training or work experience in EV manufacturing and maintenance.

Manufacturing electric vehicles requires less labor and fewer components than combustion engine vehicles, and therefore fewer direct jobs. However, studies in the United States and Europe have shown that growth in electricity infrastructure for EVs and clean fuel supply for hydrogen vehicles is likely to dwarf job losses in manufacturing jobs.

All new employment opportunities should provide people with decent work, meaning that these jobs should offer fair compensation, safe working conditions, equal opportunities, and social protections. These jobs must be free of forced and child labor and provide employees the right to organize or discuss work-related issues.

As of 2019, there were around 1.3 million jobs working on EVs around the world (10% of total auto sector employment), including 460,000 jobs in manufacturing and 850,000 jobs in EV supply chains.

1984: Human rights allegations in critical minerals mining

Historical Data Methodology and Challenges:

Data was calculated by counting the cumulative number of allegations each year from the Transition Minerals Tracker.

The Transition Minerals Tracker surveys allegations of human rights abuses in the mining of six metals (lithium, copper, cobalt, zinc, manganese and nickel, which are used for clean energy technologies) that are publicly reported by at least two reliable sources. Allegations of human rights abuses include 65 indicators grouped in six categories: impacts on the local community and attacks against civil society organizations; impacts on workers; governance and transparency; security issues and conflict zones; environmental impacts; and issues related to the COVID-19 pandemic.

The number of violations counted is based on allegations of human rights abuses. Allegations include attacks on human right defenders but do not currently include allegations related to refining or smelting activities. 

The clean energy transition is expected to bring a massive increase in the use and mining of critical minerals such as cobalt, copper, lithium, nickel, zinc and rare earths. It is estimated that under a net-zero scenario, the market for critical minerals will need to triple from 2023 to 2030.

Human rights violations related to mining projects in general and critical mineral mining in particular are well documented.

The Transitions Minerals Tracker surveys publicly reported allegations of human rights abuses in the mining of lithium, copper, cobalt, zinc, manganese, bauxite and nickel. It records allegations against 65 indicators grouped in six categories: environmental impacts, impacts on the local community (including attacks against civil society organizations), impacts on workers, governance and transparency, security issues and conflict zones, and issues related to the COVID-19 pandemic.

The database noted just 10 allegations in 2010, but that number has grown as mining for critical minerals has increased. There were 91 recorded allegations in 2023.

The number of allegations of human rights violations in critical mineral extraction is one indicator of equity during the energy transition. Similar indicators focusing on one or more clean energy technologies also exist, but this is considered a better proxy because critical minerals are required for most clean energy technologies.

As the energy transition unfolds, progress on this indicator will be measured by a decreasing number of new allegations of human rights violations.

1905: Average cost of a new light-duty electric vehicle

Historical Data Methodology and Challenges:

Data includes the sales-weighted average price of BEV

The shares of electric light-duty vehicles need to continue to grow dramatically this decade, maintaining strong adoption rates through to the mid-century. Currently, the share of electric vehicles (EVs) in global light-duty vehicle sales stands at 10%, which needs to reach up to 75-95% by 2030 and 100% by 2035.

Although consumers are beginning to prioritize the environment in their daily purchasing decisions, the adoption of EVs remains relatively low. There are multiple challenges, including the availability of charging infrastructure and the range of EVs, but consumers often cite the high purchase price of new EVs as the single-biggest barrier to change.

To realize change at the scale necessary, the average price of light-duty EVs will need to continue to decrease to become as cheap as or cheaper at the point of purchase as internal combustion engine vehicles.. Costs will primarily be driven down through increased deployment and technology innovation, which can be enabled by policies and regulations increasing sales. There is no globally consistent and freely available data covering the mean price of EVs. However, battery costs make up about 30-60% of total EV prices, and the costs of battery packs fell globally from $1,220/kilowatt-hour (kWh) in 2010 to $132/kWh in 2021. Prices went up in 2022 for the first time in over a decade due to a supply crunch in necessary components, but have already begun to decline again in 2023.

1906: Average cost of a new medium- and heavy-duty electric vehicle

The sales of electric medium- and heavy-duty vehicles need to grow at unprecedented speeds in this decade, maintaining strong adoption rates through to the mid-century. Currently, the share of electric vehicles (EVs) in global medium- and heavy-duty vehicle sales stands at only 2.7%, which needs to reach up to 30% by 2030 and nearly 100% by 2050.

The three main factors that will influence the transition to EVs are: (1) the cost to own and operate medium- and heavy-duty electric vehicles, (2) the availability of electric trucks, and (3) the charging network that will enable business operations to continue without major disruption or change. The total cost of owning and operating an electric heavy truck is approaching parity with fossil fueled counterparts. In Europe, for example, electric trucks should be as cheap to own and operate as diesel trucks by 2026. Electric and fuel cell trucks are becoming much more available–from 2021 to 2023, the number of models available increased from 255 to 418. Finally, the charging network continues to grow at significant rates, although the larger batteries in electric trucks require charging stations specifically designed for heavy-duty vehicles.

To realize change at the scale necessary, the average cost of medium- and heavy-duty EVs will need to fall dramatically this decade. Costs will be driven down through increased deployment and technology innovation, which can be enabled by policies and regulations increasing sales. There is no globally consistent and freely available data covering the mean price of EVs. However, the costs of battery packs fell globally from $1,220/kilowatt-hour (kWh) in 2010 to $132/kWh in 2021. Prices went up in 2022 for the first time in over a decade due to a supply crunch in necessary components, but have already begun to decline again in 2023.

1955: Cost of battery storage

Historical Data Methodology and Challenges:

Data must be purchased from BloombergNEF.

Batteries are a key component of electric vehicles (EV). This indicator tracks the price of lithium-ion (Li-ion) batteries — a relatively advanced and widely used battery technology in EVs.

Li-ion battery pack prices have been declining sharply since 2010, at a rate that surpasses the cost decreases of many other clean energy technologies. In 2010, battery prices stood at around $1,220 per kilowatt-hour (kWh), and in 2021 this decreased nearly tenfold to $132 per kWh. Prices went up in 2022 for the first time in over a decade due to a supply crunch in necessary components, but have already begun to decline again in 2023.

Although the significance of these trends cannot be understated, batteries (and therefore EVs) remain expensive and are particularly unaffordable for emerging economies. The cost of the battery makes up 30-60% of the total cost of an EV, so battery cost declines will help make EVs more affordable relative to their fossil fuel-powered counterparts.

Other shift Other shifts needed to transform the system

Guarantee reliable access to safe and modern mobility

All people deserve access to opportunities via safe transport and convenient mobility options. The transition of the world’s energy systems to decarbonized travel modes must be accomplished equitably in a way that enhances access to opportunity for everyone.

Reduce avoidable vehicle and air travel

The most cost-effective means of reducing transport emissions is to avoid the need for motorized travel, utilizing city planning to bring opportunities closer to residents and encouraging less carbon-intensive modes of movement, such as public transport, walking and cycling.

Shift to public, shared and non-motorized transport

Achieving a sustainable, low-carbon transport system demands a comprehensive approach: avoiding unnecessary trips, shifting travel to more sustainable modes, improving transport technology and increasing access to jobs and opportunities.

Transition to zero-carbon shipping and aviation

Although both shipping and aviation are seen as “hard-to-decarbonize,” both sectors have pathways to a greener future. Decarbonizing shipping and aviation will require a combination of technological solutions, such as zero-emission fuels and batteries, alongside operational and efficiency improvements.