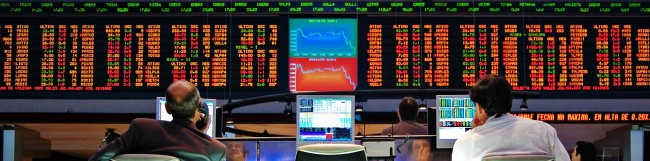
Economic growth, measured primarily by GDP, has long been a central goal of economic planning and policymaking. While GDP growth has supported positive trends such as poverty reduction, it has been accompanied by societal costs like climate change, environmental degradation and increasing inequality.

The limitations of GDP as a measure of prosperity

For decades, a central goal of the economic system has been the pursuit of economic growth, with gross domestic product (GDP) as the reigning macroeconomic metric. Governments use GDP to guide and monitor economic planning, design and assess the effects of economic policies, prepare national budgets, and compare the health of their economy against other countries. Development financing, debt relief and even UN membership fees are often contingent upon a country’s GDP. Businesses use GDP to monitor the state of the economy and industries and to make strategic decisions.

However, experts have long warned against conflating GDP with prosperity because it does not measure the quality of economic growth as it relates to ecosystem health, sustainability or people’s subjective and objective well-being. While GDP’s growth since 1960 — an increase of more than 7,000% — has been accompanied by benefits like poverty reduction, improved access to health and education, and reduced child mortality, this growth has come at a cost.

The Sustainable Development Index shows that most of the 163 tracked countries are not achieving human development within ecological limits or planetary boundaries, and 40% of countries have gotten worse over time. Income and wealth inequalities have also been on the rise since the 1980s, resulting in increased political instability and polarization. Recent research from the Earth Commission shows the world is not operating within the safe and just limits of what the planet can afford for seven out of eight earth systems, including climate, aerosol pollutants, natural ecosystems, working landscapes, surface water, groundwater, nitrogen and phosphorus. In other words, global economic development to date has resulted in extreme risks to earth system stability and human livelihoods.

Human activities pushed most earth systems beyond safe and just limits


Why GDP remains the dominant economic metric

GDP continues to be the dominant goal for economic planning and policymaking for three primary reasons. First, accounting rules and recommendations for measuring GDP are well-established by the United Nation’s System of National Accounts (SNA). The high degree of international acceptance of the SNA has led to widespread adoption by national statistical agencies, policymakers, international institutions and businesses, and has resulted in frequent conflation of GDP with prosperity.

Second, there is a lack of coordination across researchers, countries and international institutions on alternative progress indicators and “beyond GDP” metrics covering well-being, equity and sustainability dimensions. Most countries track a wide variety of such indicators but vary in terms of indicator selection, data collection and analysis methods, reporting practices, and ability to integrate findings into policymaking processes. Subsequently, there is a lack of comparability across countries for indicators representing dimensions of well-being, equity and sustainability.

And third, countries lack the technical and financial capacity, and sometimes political will, to develop and embed alternative prosperity indicators in their national statistical agencies and economic plans and policies.
 

How to remove GDP lock-in

To remove GDP lock-in, governments need to systematically integrate well-being, equity and sustainability goals into central economic planning. For instance, governments can work to de-silo policymaking across agencies and consider integrating goals across various national strategies that touch on climate, nature and equity issues (e.g., national development plans, nationally determined contributions and National Biodiversity Strategies and Action Plans). International institutions that support development efforts must also ensure their missions, decision-making processes and results frameworks are tied to these wider goals.

To increase global harmonization and uptake of alternative progress indicators, governments and international institutions can support the creation of a core set or dashboard of internationally-agreed upon well-being, equity and prosperity metrics and associated accounting rules, possibly linked to the UN Sustainable Development Goals. This set of metrics could be elevated to the same international level as GDP to increase acceptance, working through the SNA and satellite accounts.

Tracking progress on global outcomes

2861: Governments integrating well-being, equity and sustainability goals into economic planning

Status: Insufficient Data

Most governments develop centralized economic planning strategies to guide policymaking over periods of 5 to 25 years. At least 134 countries have national development plans, most often led by ministries of finance, economic planning or national planning commissions. This indicator tracks the extent to which well-being, equity and sustainability goals are systematically embedded in such planning strategies; however, no globally comprehensive data currently exists.

While countries are increasingly tracking well-being, equity and sustainability metrics, including the Sustainable Development Goals (SDGs), these are not embedded as central economic planning goals to the same extent as indicators like GDP, as countries struggle to develop “whole-of-government” approaches to policymaking.

Countries also struggle to integrate climate and nature-related plans and strategies developed under international agreements like the United Nations Framework Convention on Climate Change (e.g., nationally determined contributions and national adaptation plans) and the United Nations Convention on Biological Diversity (e.g., National Biodiversity Strategies and Action Plans) into economic planning. Ensuring consideration of national goals across strategies is important to ensure that policymakers develop solutions that work for people and the planet.

2862: International institutions integrating well-being, equity and sustainability goals into their central strategies

Status: Insufficient Data

International financial institutions such as the World Bank and the International Monetary Fund, regional development banks, and intergovernmental organizations such as United Nations (UN) agencies and the Organisation for Economic Co-operation and Development (OECD) play key coordinating, capacity-building and financing roles in supporting countries in their development pathways.

Given this, it is critical that these international institutions align their missions and strategies with well-being, equity and sustainability goals, including those established in the UNFCCC Paris Agreement, the Sustainable Development Goals (SDGs) and the UN Convention on Biological Diversity. While there are some examples of this in practice, there is no globally comprehensive data to track progress for this indicator.

The World Bank, for example, has a Paris Alignment strategy and vetting approach for projects, which requires that “new financing flows and guarantees provided by the Bank Group will be consistent with the objectives of the Paris Agreement and a country’s pathway towards low greenhouse gas emissions and climate-resilience framework.”

The OECD’s 10-year vision explicitly recognizes intertwining global crises of climate change, biodiversity loss and inequity and affirms its commitment to contribute to the SDGs and the Paris Agreement. These commitments represent progress, but more effort is needed to ensure all international institutions are following suit.

Key enablers and barriers to change

2866: Countries supporting a globally harmonized accounting framework for well-being, equity and sustainability indicators

To remove GDP lock-in for measuring prosperity, many experts, together with the United Nations (UN), recommend developing a globally harmonized accounting framework and dashboard for a set of 10-20 well-being, equity and sustainability metrics. Having a core set of metrics tracked by every country would allow for cross-country comparison of economic progress beyond economic dimensions and would emphasize the international importance and acceptance of prosperity dimensions beyond economic growth.

This set of metrics could build from existing international efforts such as the Sustainable Development Goals (SDGs) and could be connected to the UN System of National Accounts (SNA) to promote global adoption and harmonization of definitions and accounting rules. The UN Secretary-General has proposed that the process of selecting and verifying metrics be conducted by the UN Statistical Commission, which also hosts the global indicator framework for the SDGs.

Advocates for this approach suggest that this core set of indicators cover the following aspects of well-being, equity and sustainability: objective well-being (e.g., human health, education, economic security), subjective well-being (e.g., life satisfaction, time spent with family, social connections and relationships), social equity (e.g., income, wealth, purchasing power and consumption), human capital, natural capital, physical capital, and institutions, political voice and governance.

To allow for country-specific goals and contexts, advocates for a core set of indicators also suggest that governments develop country-specific indicators they deem important for contributing to prosperity. The efficacy of this approach requires countries to support this framework, but there is no publicly available data tracking this.

The SNA is currently undergoing a revision process that will be finalized in 2025. This revision process only happens every 15 years. Three priority areas were identified for this round of revisions: digitalization, globalization, and well-being and sustainability.

The recently released draft of the 2025 SNA for global consultation includes chapters on these three areas, but the draft also states that it “does not provide an overarching or inclusive framework for the integration of all aspects of well-being and sustainability. A comprehensive assessment of well-being and sustainability requires additional measures, for example, measures relating to safety and governance.” In other words, the SNA has not gone so far as to revise the SNA formula (e.g., by revising its accounting boundaries or extending the range of stocks and flows) nor address equity considerations in a more meaningful way.

2867: International institutions supporting a globally harmonized accounting framework for well-being, equity and sustainability indicators

International institutions — especially those involved in the development of the UN System of National Accounts (SNA) and its satellite accounts like the System of Environmental-Economic Accounting — can increase harmonization of a global accounting framework for a set of well-being, equity and sustainability metrics by advocating for widespread adoption. These institutions include the UN, the Food and Agriculture Organization, the European Commission, the Organisation for Co-operation and Economic Development (OECD), the World Bank and the International Monetary Fund.

Many of these institutions have developed indicators, indices or frameworks covering well-being, equity and sustainability dimensions that they use to track economic progress and make development and financing decisions. Examples include the UN’s Sustainable Development Goals indicators, Human Development Index, and Inclusive Wealth Index; OECD’s Better Life Index; and the World Bank’s Genuine Savings, Adjusted Net Savings and Comprehensive Wealth indicators.

These approaches could be taken into account in the harmonization effort. Support from international institutions can then help pave the way for countries to also support and adopt a harmonized core set of prosperity metrics. Support could take the form of a publication or demonstrating support at UN SNA discussions, for example. Because support takes many forms, it is difficult to track comprehensively, so no data source has been identified.

2868: OECD governments that are embedding well-being, equity and sustainability indicators into policymaking

It is not enough for governments to simply track and report on well-being, equity and sustainability indicators — those indicators must also be embedded into policymaking processes. Ideally, following the establishment of a globally harmonized set of alternative prosperity indicators and associated accounting rules, governments will embed those specific indicators, along with others relevant to their local context.

This indicator tracks the number of national and subnational governmental entities (e.g., ministries of finance or economic planning, state governments, and municipal governments) that have embedded well-being, equity and sustainability indicators into policymaking processes through institutional mechanisms such as constitutional reforms, budget law, mandated analytical requirements, or policy and performance frameworks.

Many countries are already taking action. For instance, 27 countries, making up 71% of the member countries of the Organisation for Economic Co-Operation and Development (OECD), have well-being policy and monitoring frameworks that can be used for tracking progress and informing policy decisions.

Additionally, six national governments have joined the Wellbeing Economy Alliance’s Governments partnership: Canada, Finland, Iceland, New Zealand, Scotland and Wales. These countries have agreed to share expertise and transferrable policy practices to advance their shared ambition of building “well-being economies.”

2869: International institutions embedding well-being, equity and sustainability indicators into decision-making

International institutions must embed well-being, equity and sustainability indicators into their decision-making processes to ensure their coordinating, financing and capacity building decisions support their associated mission statements and strategies. Ideally, following the establishment of a globally harmonized set of alternative prosperity indicators and associated accounting rules, international institutions will embed those specific indicators.

There is no dataset that tracks the number of international institutions that have embedded well-being, equity and sustainability indicators as principal indicators in decision-making processes through institutional mechanisms such as their policy and performance frameworks. A review of international institutions’ annual reports or relevant publications or a survey of international institutions could support future data collection.

2870: Businesses with a legal mandate or corporate by-laws requiring them to be purpose-driven

Businesses have vital roles to play in the economy as providers of goods and services, job creators, innovators and value creators. Business goals generally center on profit maximization and increasing shareholder value, but increasingly, businesses are being called upon to reorient their priorities to align with well-being, equity and sustainability goals and adopt associated key performance metrics.

Many initiatives and concepts have been developed in recent years to make business operations more sustainable and well-being-oriented. Examples include reporting, investment, disclosure and target setting frameworks like environmental, social and governance (ESG) investing, the Taskforce on Nature-related Financial Disclosures, the Task Force on Climate-related Financial Disclosures (covered by the finance system), and the Science Based Targets initiative.

Examples also include rethinking business models and policies by adopting legal commitments to being purpose-driven, abandoning behaviors like hostile takeovers and mergers and donations to political parties, promoting stakeholder value instead of just shareholder value, or investing in employees by giving them better wages and ownership over the enterprise.

However, many of these efforts have been undermined by a lack of corporate accountability and governmental mandates, as well as a lack of business motivation and willingness to change perceptions on what it means to produce “value.”

As a proxy for estimating how businesses are shifting goals away from being solely profit-driven, this indicator looks at the number of Certified B Corps. To receive B Corp certification, businesses must demonstrate a high level of social and environmental performance, have a legal commitment by changing their corporate governance structure to be accountable to all stakeholders (not just shareholders) and display a high degree of public transparency on their performance and impacts. In 2025, 10,495 businesses were Certified B Corps, a growth of 181% since 2020. However, this represents a small fraction of total businesses globally.

2871: Countries regularly implementing and publishing on the UN System of Environmental-Economic Accounting framework

Historical Data Methodology and Challenges:

Data was compiled from UN’s Global Assessment of Environmental Accounting Reports. The number of countries was determined by counting the number of countries implementing the Central Framework (CF) and Ecosystem Accounting (EA) Framework.

Global values were extracted from Figure 1. Number of countries implementing the SEEA (2014-2025). Country-level data is directly extracted from the Global Assessment Results series. Country-level data is not available for 2014 or 2019.

The United Nations (UN) System of Environmental-Economic Accounting (SEEA) has become the leading statistical framework for natural capital accounting. Natural capital accounts help enable policymakers to understand how the environment impacts and is impacted by economic activities.

The SEEA provides internationally agreed-upon definitions, classifications and accounting rules to promote international consistency in tracking and reporting on economic and environmental data. It consists of two frameworks: the Central Framework (SEEA CF) and the Ecosystem Accounting (SEEA EA) framework. The SEEA EA framework provides the methodological basis for many indicators of the monitoring framework for the Kunming-Montreal Global Biodiversity Framework.

In 2025, 98 out of 193 UN Member States were implementing SEEA, with 97 implementing the SEEA CF and 58 implementing the SEEA EA. A country is considered “implementing” if it has compiled any part or account within each framework; to date, most countries are in the pilot stage.

Adoption of SEEA is most prevalent in Europe and North America, with action in Europe being driven by a legal mandate from the European Union. The UN Statistical Commission established a goal of at least 60 countries with SEEA EA programs by 2025.

Over half of the countries implementing the SEEA CF are focused on energy, environmental protection and management expenditure, air emissions, and material flows. Less than half of countries are focused on environmental taxes and subsidies, water, agriculture, forestry and fisheries, land and waste accounts. With respect to the SEEA EA, most have focused on collecting data on marketed ecosystem services like crops and wood products, as well as climate regulation services. Water supply, recreation and other important regulatory and cultural services that are not as easily valued in a marketplace are less well compiled.

An important dimension of sustainability that SEEA does not cover is safe operating limits for earth systems. The Earth Commission has quantified safe and just earth system boundaries at the global level and is working to disaggregate this data on a more local level. In the future, SEEA or the System of National Accounts (SNA) could be adjusted to provide guidance for countries on tracking national performance against these boundaries. SEEA could also be more closely linked with the SNA central framework to increase uptake of implementation and reporting by governments.

2913: People who think well-being, equity and sustainability metrics are as important as economic ones

Historical Data Methodology and Challenges:

This number represents a simple global average that is based on a nationally representative survey conducted by the data source across 11 countries (Australia, Brazil, Canada, China, France, Germany, India, Kenya, Russia, the United Kingdom and the United States) (n=1,000 per country).

Shifting public sentiment on what constitutes national “prosperity,” captured through global surveys, is an important indicator as political leaders, especially in democratic governments, are more likely to broaden their economic planning goals and metrics if there is strong public support to do so.

This indicator is based on a public opinion survey from GlobeScan and Ethical Markets that gauges responses to the “Beyond GDP” movement. This survey was first launched at the European Commission’s Beyond GDP conference in 2007 and was repeated in 2009, 2013 and 2020. The survey was implemented in Australia, Brazil, Canada, China, France, Germany, India, Kenya, Russia, the United Kingdom and the United States.

The 2020 survey found that, on average across the 11 countries, 72% of respondents preferred broadening beyond economic indicators with health, social and environmental data to gauge national progress. All countries demonstrated greater than 50% public support for broader measurements of national progress, with respondents in Brazil, Canada, France, Germany, Kenya and the United Kingdom showing greater than 75% support.

A 2021 survey of G20 countries on attitudes toward planetary stewardship and transformation, carried out by the Global Commons Alliance, found similar results: 74% of respondents supported the idea of their country’s economic priorities shifting beyond economic growth to include human well-being and ecological protection.

2872: Ratio of GDP or economic growth mentions to well-being, equity and sustainability mentions in major media outlets

Economic narratives discussed in mainstream media (including newspapers, social media, television news, radio and other content available online) can influence the general public’s and decision-makers’ understanding of the economy and perceptions of risk. Reigning narratives of economic progress still largely focus on economic growth and GDP, and on nature only as a subset of the economy.

One study of New York Times content, for instance, compared the prevalence of “GDP” and “economic growth” to mentions of major beyond-GDP initiatives such as the Genuine Progress Indicator, Human Development Index and Sustainable Development Goals. It found “GDP” and “economic growth” mentions to be 46x and 99x greater, respectively.

To ensure comprehensive reporting on economic progress, media outlets must look beyond macroeconomic metrics to encompass changes in well-being, equity and sustainability.

Ideally, this indicator would capture how society and media reflect on economic progress or prosperity in relation to public policies, investments and complex challenges like climate change, biodiversity loss and rising social inequalities, but no comprehensive data currently exists.

Given the wide variety of alternative prosperity indicators, media outlets and types, and potential search terms, this indicator would be incredibly difficult to track. However, advances in machine learning, AI and topic modeling could be leveraged in the future.

Data challenges

Comprehensive, global data is limited on the adoption of improved management practices across terrestrial ecosystems, including forests, grasslands, savannas and shrublands. Not only do terrestrial ecosystem ownership and management structures vary widely across the globe — creating challenges for centralized data collection — but approaches to and definitions of “improved” management also differ across socioeconomic and geographic contexts and landscapes. Ecological diversity within and across terrestrial ecosystem types poses a challenge, as management practices cannot be uniformly applied.

Other shift Other shifts needed to transform the system

Embed climate, nature and equity into economic analysis

Policies aimed at climate, nature and equity have major implications for traditional economic goals, and vice versa. However, the economic analysis toolkit used to understand the economy and evaluate policies is only beginning to incorporate them.

Transform economic policies to accelerate action for climate, nature and equity

Governments use economic policies to meet national development goals, and fiscal policies in particular are critical to address climate change, protect biodiversity and promote equity. Governments can better tax environmental harms and invest in the green economy.